
Figure 2.
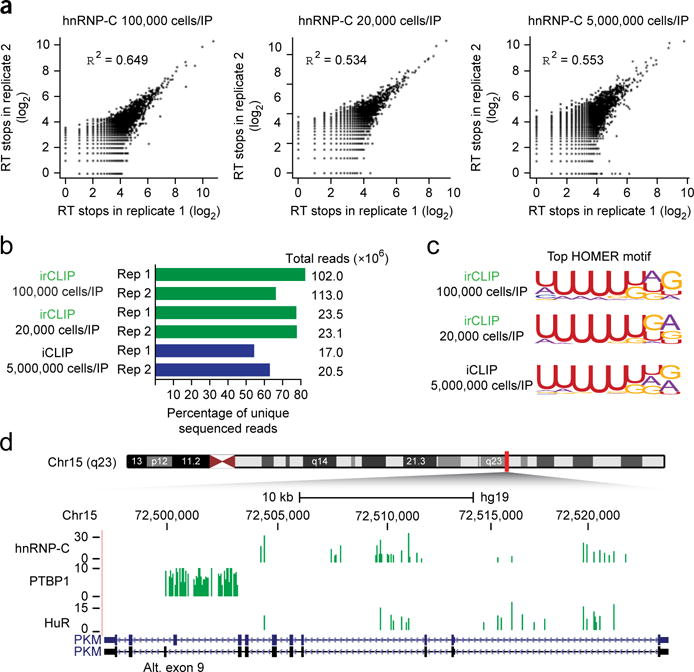
irCLIP produces high-quality data sets with greatly reduced cellular inputs, (a) Pearson correlations of RT stops between biological replicates of hnRNP-C irCLIP of the indicated number of cells per immunoprecipitation. (b) Histogram of the unique read fractions of the hnRNP-C irCLIP and iCLIP biological replicates, (c) Top HOMER motif identified for all significant hnRNP-C clusters from the indicated data set. (d) Comparison of significant (FDR < 0.05) hnRNP-C, PTBP1, and HuR clusters identified with irCLIP at the PKM locus. Alt., alternate. Green, irCLIP; blue, iCLIP.