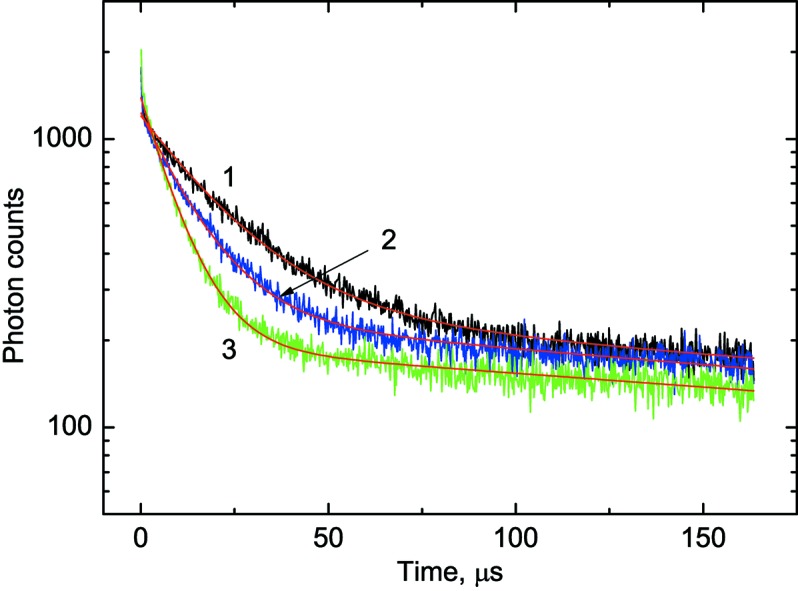
Figure 6.

Luminescence decay curves of the BGO scintillator at UV excitation (λ = 245 nm) measured at different temperatures. The red lines show the fitting to the experimental data using two exponential decay functions:  =
=  for different temperatures. Curve 1: T = 31 K;
  = 20.7 ± 0.19 µs. Curve 2: T = 50 K;
  = 13.1 ± 0.12 µs. Curve 3: T = 121 K;
  = 6.8 ± 0.07 µs.
