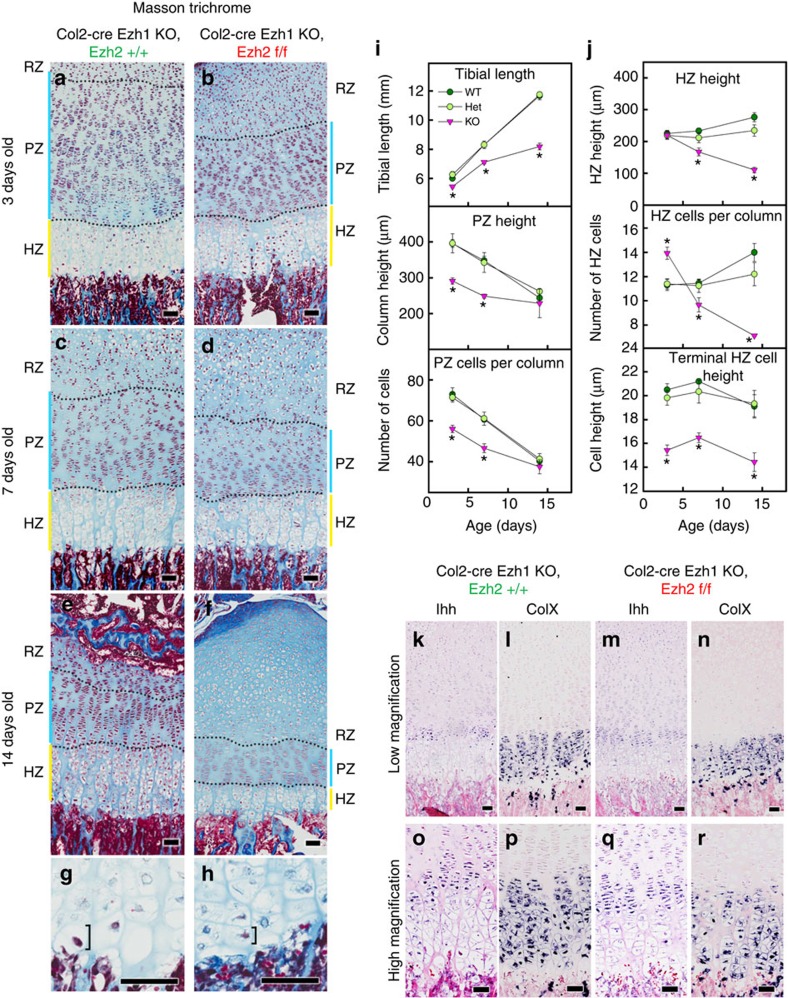
Figure 2. Quantitative histology of proximal tibial growth plate.
(a–f) Histological sections of proximal tibias of Ezh1−/− mice with cartilage-specific knockout for Ezh2 (b,d,f) or wild type for Ezh2 (a,c,e) at 3 days (a,b), 1 week (c,d) and 2 weeks (e,f) of age. HZ, hypertrophic zone (yellow bars); PZ, proliferative zone (blue bars); RZ, resting zone. (g,h) Higher magnification of hypertrophic chondrocytes of Ezh1−/− mice that are wild type (g) or with cartilage-specific knockout for Ezh2 (h) at 3 days old to illustrate the difference in terminal hypertrophic cell height (bracket). (i,j) Quantitative histological measurements of tibial length, PZ height and number of cells per proliferative column (i), and HZ height, number of cells per hypertrophic column and terminal hypertrophic cell height (j) in Ezh1−/− mice that are wild type (WT, N=6), heterozygous (Het, N=6) or with cartilage-specific knockout (KO, N=8) for Ezh2. *P<0.05 versus both WT and Het within the same age group. (k–r) In situ hybridization of Ihh (k,m,o,q) and ColX (l,n,p,r) of proximal tibias of Ezh1−/− mice with cartilage-specific knockout for Ezh2 (m,n,q,r) or wild type for Ezh2 (k,l,o,p) at 1 week of age. Error bars, ±s.e.m. Scale bars, 50 μm.

