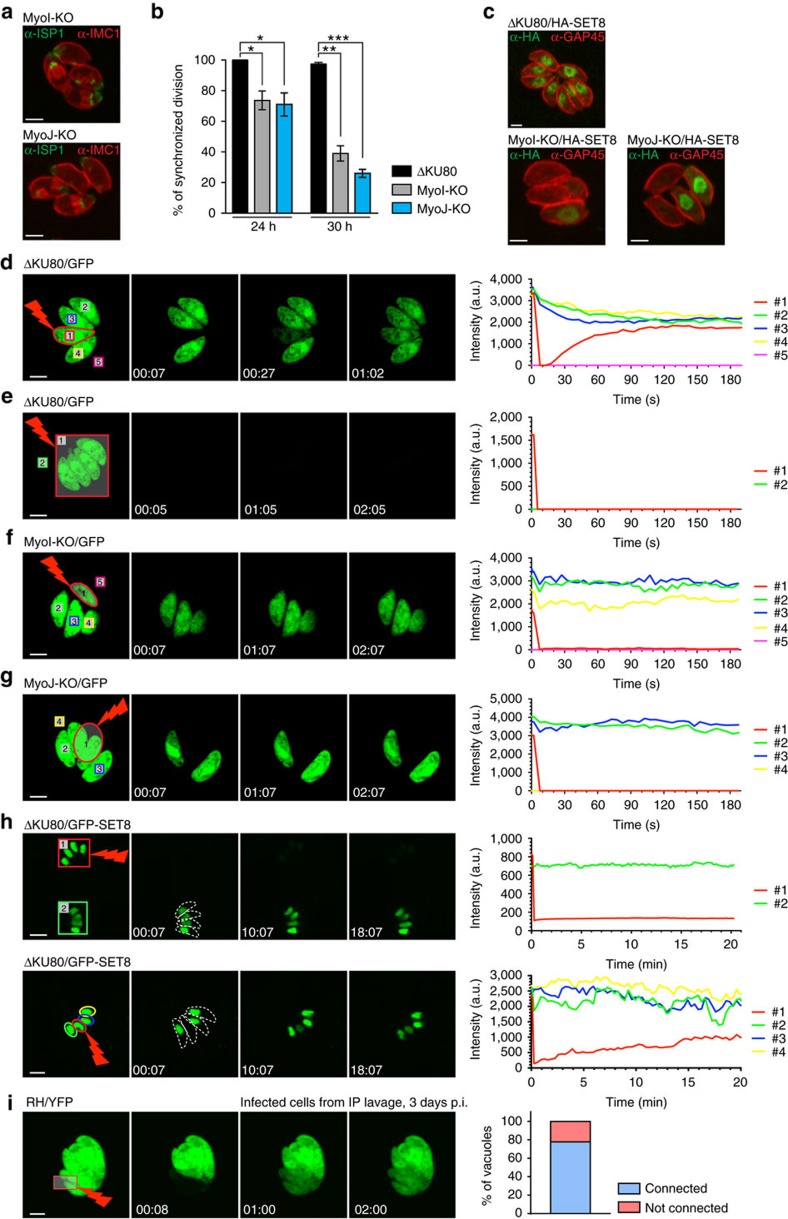
Figure 6. Intravacuolar TgMyoI-KO and TgMyoJ-KO parasites divide asynchronously and are not connected.
(a) IFA showing the intravacuolar asynchronicity of division in MyoI- and MyoJ-KO stained with α-ISP1 and α-IMC1 24 h post infection. Scale bar, 2 μm. (b) Quantification of the synchronicity of intravacuolar division after 24 and 30 h of growth. Results are represented as mean±s.d. from three independent experiments and the significance of the results was assessed using a parametric paired t-test. The two-tailed P-values are: 0.0219 (*) and 0.0175 (*) for MyoI-KO and MyoJ-KO, respectively, compared to ΔKU80 at 24 h and 0.0016 (**) and 0.0007 (***) at 30 h. (c) Transient transfection of SET8-HA shows that intravacuolar parasites are all in the same phase of their cell cycle in ΔKU80 in contrast to intravacuolar MyoI- and MyoJ-KO parasites. Scale bar, 2 μm. (d–h) Left panels: time-lapse imaging of FRAP experiments performed on type I tachyzoites ΔKU80 (d,e), MyoI-KO (f) and MyoJ-KO (g) transiently transfected with GFP or on type I tachyzoites ΔKU80 transiently transfected with SET8-GFP (h). The bleached areas are delineated in red. Right panels: quantification of the intensity of GFP fluorescence recorded in the areas numbered on the left panels. Scale bars, 2 μm (d–g) and 5 μm (h). (i) Time-lapse imaging of a representative FRAP experiment performed on intracellular type I tachyzoites (RH-YFP) collected by intraperitoneal (IP) lavage 3 days p.i. (scale bar, 2 μm) and quantification of parasites connection in 10 vacuoles tested.

