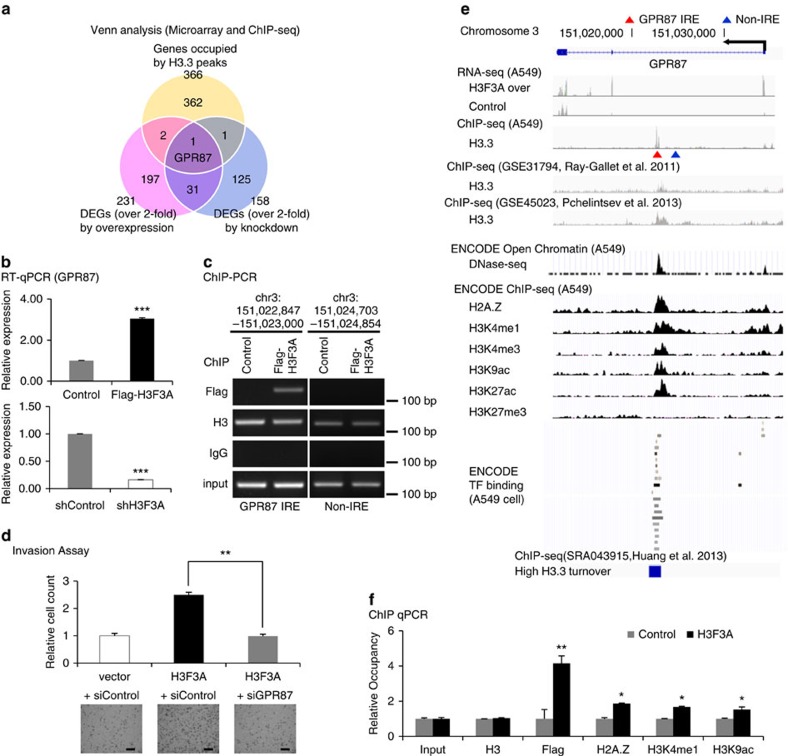
Figure 5. Selection and validation of an H3.3 target gene.
(a) Selection of putative direct target genes of H3F3A with microarray and ChIP-seq data. (b) RT-qPCR validation of the changes in the expression of GPR87 induced by H3F3A overexpression and knockdown. (c) Validation of H3.3 binding to the IRE of GPR87 using a ChIP-PCR assay (GPR87 IRE: chr3:151,022,847-151,023,000; Non-IRE: chr3:151,024,703-151,024,854). (d) Results of invasion assays after ectopic H3F3A overexpression and GPR87 knockdown. (e) Integrated analysis near GPR87 gene. (f) Chromatin status modification at GPR87 IRE due to ectopic H3F3A overexpression. Data are representative of three independent experiments. The error bars represent the s.e.m. *P<0.05, **P<0.01, ***P<0.001, t-test. Scale bar, 200 μm.

