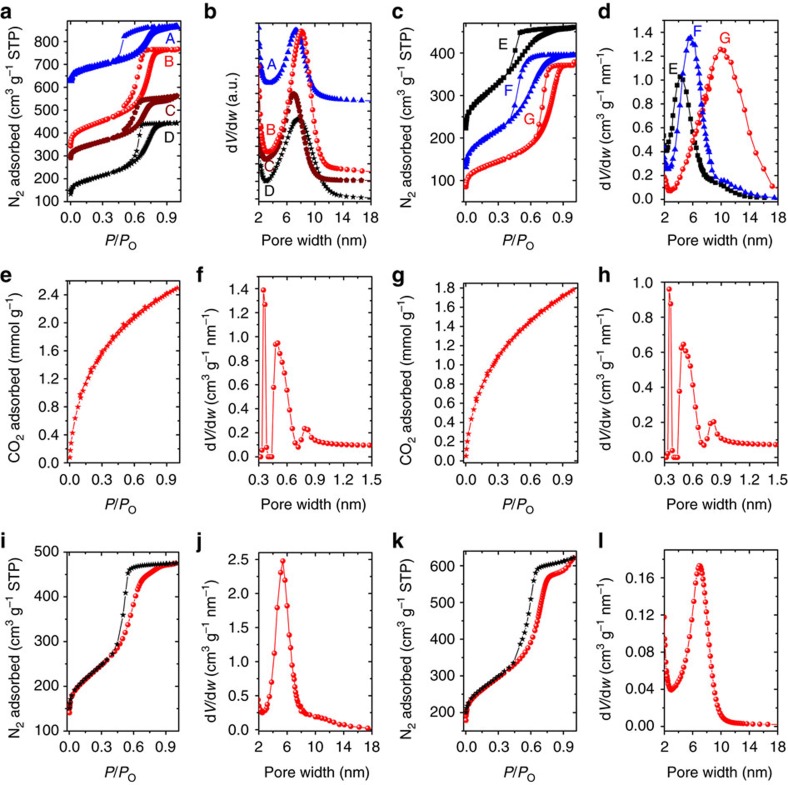
Figure 2. Characterizations of pore structure by gas sorption.
(a–d) N2 adsorption–desorption isotherms (77 K) and the corresponding pore size distributions of as-synthesized carbons. A: OMC@F1270.4-800, B: OMC@F1270.6-800, C: OMC@F1270.8-800, D: OMC@F1271-800, E: OMC@P650.8-800, F: OMC@F880.8-800 and G: OMC@(F127+Ph3P)0.8-800. For clarity, the isotherms of A, B, C and E are offset along they axis by 400 cm3 g−1, 100 cm3 g−1, 150 cm3 g−1 and 70 cm3 g−1, respectively. (e,f) CO2 adsorption–desorption isotherms (273 K) and the corresponding pore size distribution of OMC@F1270.6-800 sample. (g,h) CO2 adsorption–desorption isotherms (273 K) and the corresponding pore size distribution of OMC@P1230.8-800 sample. (i,j) N2 adsorption–desorption isotherm (77 K) and the corresponding pore size distribution of OMC@P1230.8-800 sample. (k,l) N2 adsorption–desorption isotherm (77 K) and the corresponding pore size distribution of Ni-OMC@F1270.8-450 sample.

