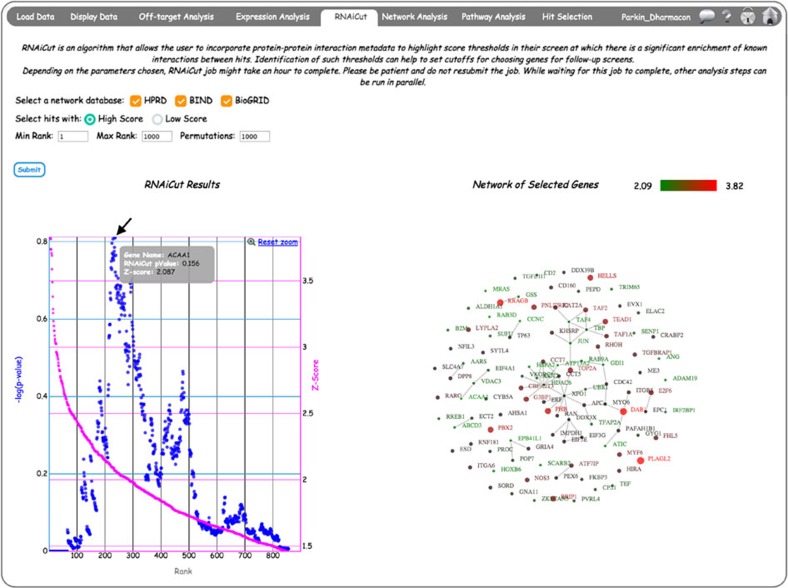
Figure 6. Implementation of the RNAiCut algorithm in CARD.
Interactive representation of sample results from RNAiCut analysis (see Methods for details). The scatterplot shows –log(P-value) and Z-score as function of gene rank (sorted based on the screen score). By mouse-over on any of these scatter plots, details like Gene Symbol, RNAiCut P-value and Z-score will appear. The maximum –log(P-value) (denoted by arrow), occurs around Z-score 2.087. Clicking on this point renders an interaction network on the right among genes with Z-scores greater than 2.087.

