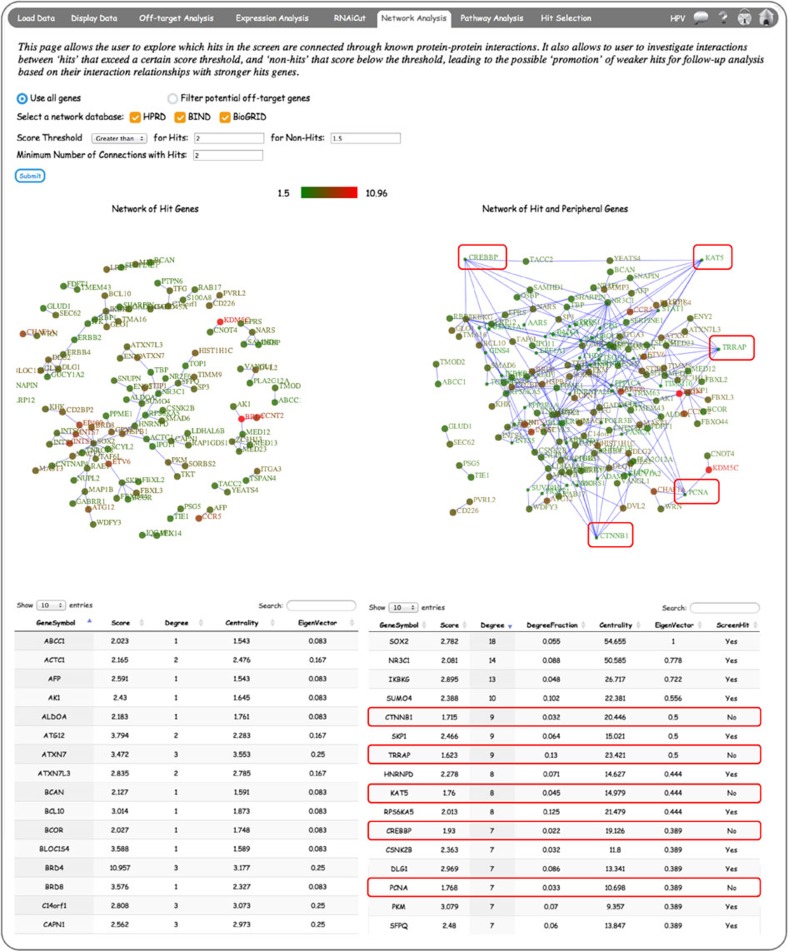
Figure 7. CARD Network Analysis integrates protein–protein interaction (PPI) data with screen data.
The left panel shows screen hits defined by chosen score thresholds that are connected based on the selected network databases. The right panel includes both ‘hits’ and ‘non-hits’ (lower scoring genes from a user-defined threshold) that are connected based on PPI network data. The hit genes in this network are represented by larger circles, and circles are coloured based on the screen score. The red boxes highlight examples of ‘non-hits’ with multiple ‘hit’ interactions from the HPV screen data set (Supplementary Table 7).

