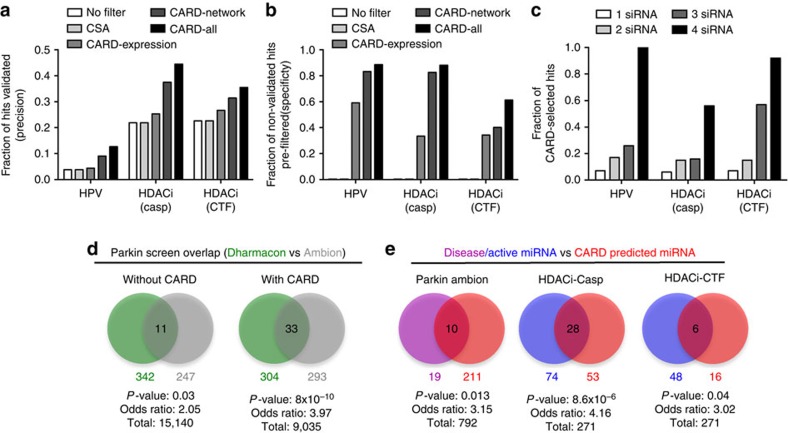
Figure 9. CARD analysis of genome-scale siRNA screens leads to improved hit selection and prediction of active miRNAs.
(a) Comparison of Precision (fraction of the hits from primary screen that are validated in the secondary screen) and (b) Specificity (fraction of non-validated hits in the secondary screen that would be eliminated by CARD filters in primary screen) with either no filter, individual filters and all filters using CARD. Both precision and specificity increase when CARD filters are applied and are highest with all filters combined. (c) Fraction of hits selected by applying all CARD filters among genes validating with different numbers of single siRNAs in the analysed HDAC inhibitor (HDACi-Casp and HDACi-CTF) and HPV screens. Additional details of parameters used in the applied CARD algorithms are provided in the Methods. (d) Comparison of the hit gene overlap between the Parkin Dharmacon (green) and Ambion (grey) screens with and without using CARD. The statistical significance of the overlap increases considerably after applying CARD filters. (e) Comparison of active miRNAs identified from miRNA mimics in the HDAC inhibitor screen (blue), or Parkinson’s Disease associated miRNAs from literature curation (purple), with predicted active miRNAs from siRNA seed enrichment in CARD analysis (red). A low P-value from Fisher’s exact test and an odds ratio >1 demonstrate the overlap significance.

