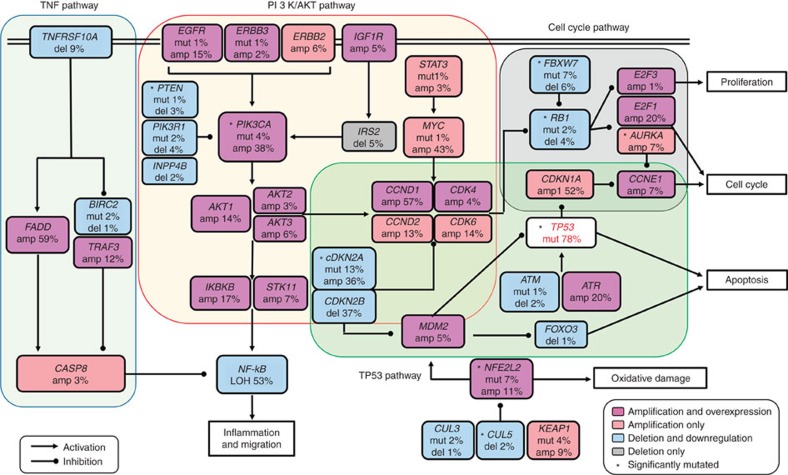
Figure 5. Significantly aberrant pathways and networks in ESCC.
The rectangles in different colours represents percentages of amplification, amplification and overexpression, deletion, deletion and low expression and mutations in genes identified in ESCC that belong to four signaling pathways as indicated in the indicators. The amplification and deletion were defined by CNV analysis (all_thresholded.by_genes.txt file from the GISTIC output). The overexpression or low expression were defined by paired t-test between tumour and normal tissues with P<0.05 and sexpression fold change >1.2 or <0.8 being considered to be significant.

