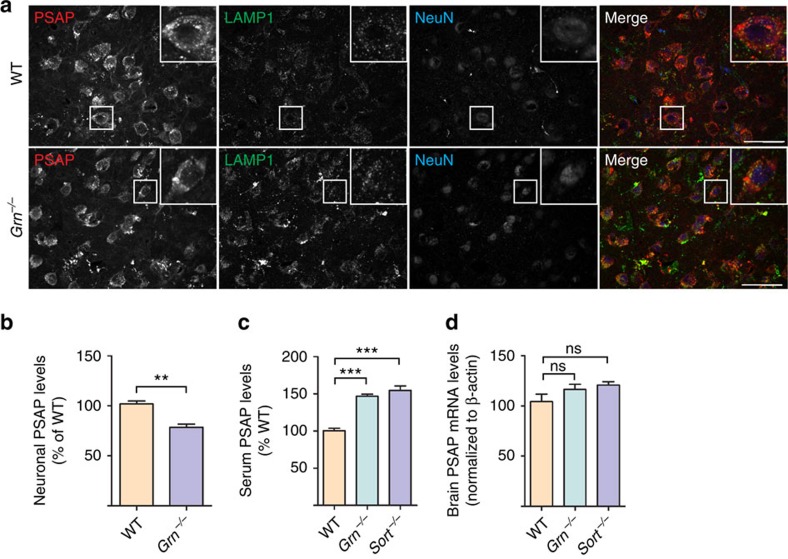
Figure 6. PGRN- and sortilin-deficient mice display PSAP trafficking defects.
(a) Representative images from immunostaining of 12–14-month-old brain sections of WT and Grn−/− mice with anti-mouse PSAP, LAMP1 and NeuN antibodies. Scale bar, 50 μm. (b) Quantification of immunofluorescence intensity of PSAP in neurons for images in a, n=4, **P<0.01, Student's t-test. (c) ELISA to measure PSAP levels in the serum of 6–8-month-old WT, Grn−/− and Sort−/− mice; n=5, ***P<0.001, one-way analysis of variance (ANOVA). (d) Quantitative PCR (qPCR) analysis of PSAP mRNA levels in the brain of 6–8-month-old WT, Grn−/− and Sort−/−mice; n=3, NS, not significant, one-way ANOVA. Data are presented as mean±SEM.

