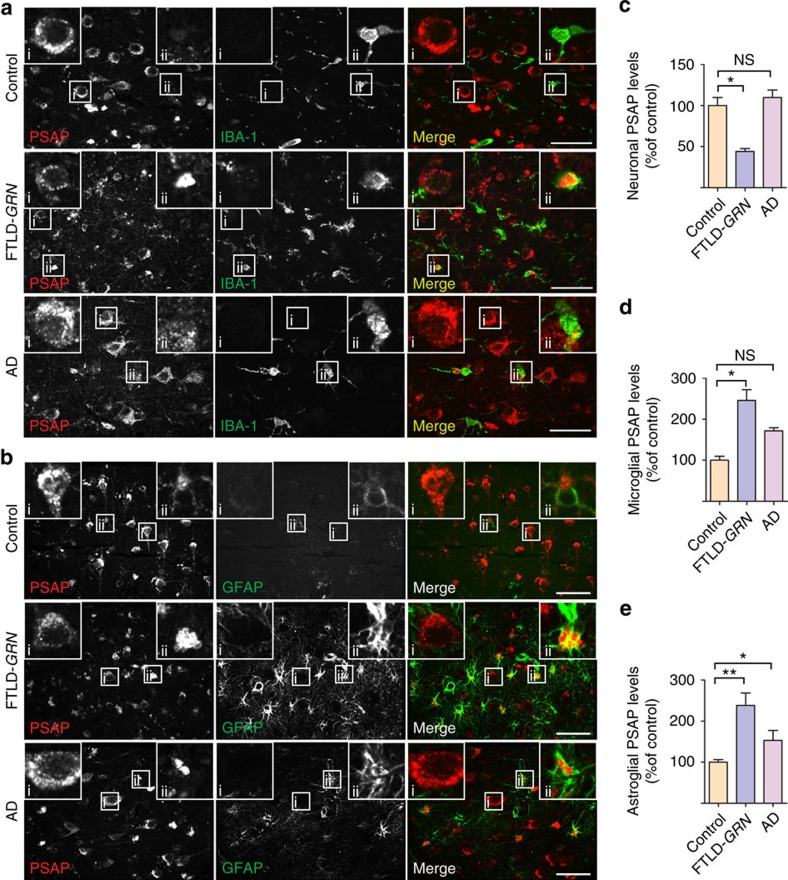
Figure 7. PSAP levels are increased in microglia and astrocytes but decreased in neurons in FTLD-GRN patients.
(a) Brain sections from control, FTLD-GRN and AD patients were stained with rat anti-PSAP and rabbit anti-IBA1 (marker for microglia) antibodies. A representative neuron was shown in inset i and a representative microglia was shown in inset ii. In contrast with increased PSAP levels in microglia, neuronal PSAP levels are much reduced in FTLD-GRN cases, but not in AD cases. Scale bar, 50 μm. (b) Brain sections from control, FTLD-GRN and AD patients were stained with rabbit anti-PSAP and mouse anti-GFAP (marker for astrocytes) antibodies. A representative astrocyte was shown in the inset. FTLD-GRN has many more activated astrocytes with high PSAP expression. Scale bar, 50 μm. (c) Quantification of neuronal PSAP levels in a; n=3, *P<0.05, NS, not significant, one-way analysis of variance (ANOVA). Data are presented as mean±SEM. (d) Quantification of microglial PSAP levels in a; n=3, *P<0.05, NS, not significant, one-way ANOVA. Data are presented as mean±SEM. (e) Quantification of astroglial PSAP levels in b; n=3, *P<0.05, **P<0.01, one-way ANOVA. Data are presented as mean±SEM.

