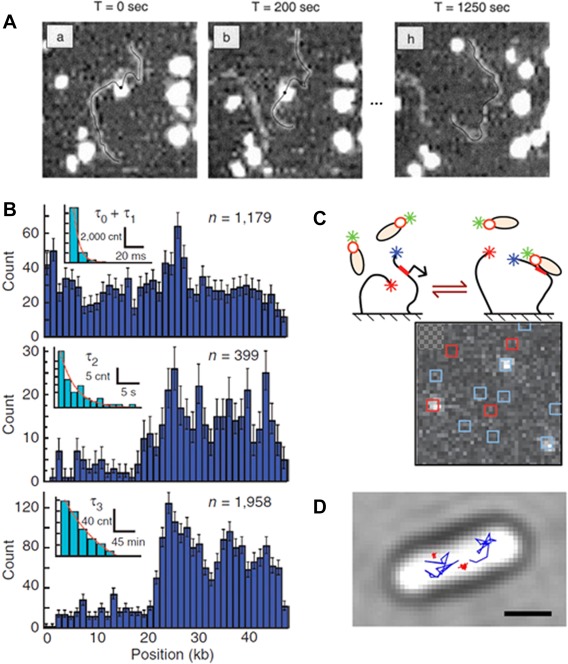
Figure 2.

The promoter search mechanism. A: AFM was applied to observe one‐dimensional diffusion of RNAP along DNA. Consecutive images (here at t = 0, 200, 1250 s) were acquired after initial observation of the RNAP‐DNA complex formation. RNAP molecules (white spot) appeared to slide back and forth on the DNA (black line). Reproduced from Ref 15. B: DNA curtains combined with fluorescence microscopy allowed to quantify the distribution of binding positions along λ‐DNA (dark blue histograms) and their binding lifetime (light blue, insets) for three kinetically distinct populations: fast and sequence nonspecific (top), intermediate at λ AT‐rich regions (middle), and long at promoter regions (bottom). Reproduced from Ref 17. C: Schematic of the single‐molecule constructs used for CoSMos experiments. Surface‐anchored DNAs (black lines) and σ54‐RNAP complexes are shown before and after binding. The labeling was set on the RNAP (green star), promoter‐containing DNA (blue star on DNA) and promoter‐free DNA (red star on DNA). The colocalization of the fluorophores was examined in consecutive images allowing to follow the RNAP complex binding kinetics. Reproduced from Ref 18. D: Single‐molecule tracking of individual RNAPs enables distinction of mobile (blue) and DNA‐bound molecules (red). The image shows sample trajectories observed in vivo. Reproduced from Ref 20.
