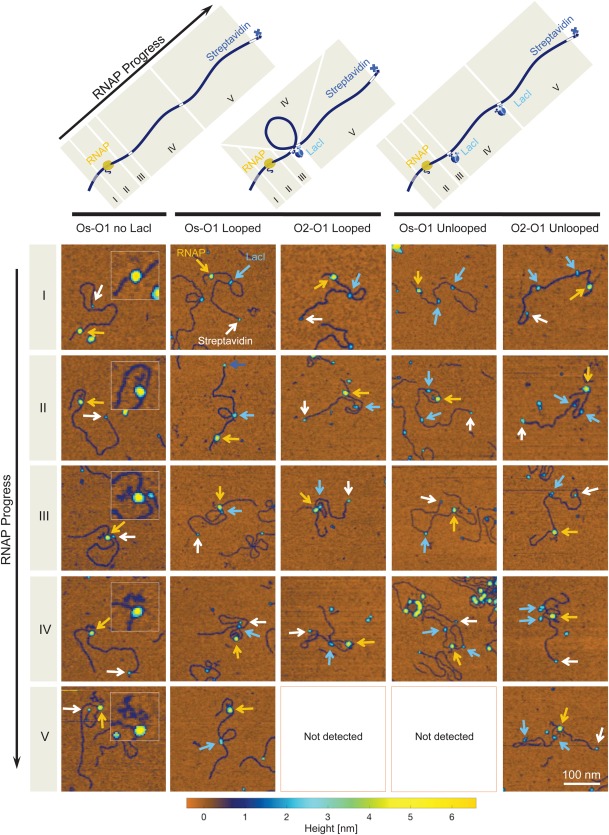
Figure 2.

Nanographs of RNAP elongation along DNA with and without LacI‐mediated loops. (Top) Schematic representations of transcription elongation complexes (TECs). Columns correspond to different DNA topologies and LacI occupancy. The first column corresponds to transcription elongation without LacI in the reaction buffer. The second and third column correspond to DNA found in a looped topology, with LacI at each of the two operators; the fourth and fifth columns correspond to unlooped DNA with both operators occupied. Transcription elongation progress is categorized in five zones (roman numerals I‐V). Numerals in the schematic correspond to each row of the nanograph array. Each image in the array is representative of its corresponding category (columns) and elongation progress (rows). Image colors indicate height, according to the color scale below. RNAP, LacI and streptavidin particles are indicated by yellow, light blue, and white arrows respectively. (Row I) AFM images of RNAP bound at the T7A1 promoter. (Row II) Images in which TECs have not yet reached the near operator. (Row III) Images in which TECs contact LacI at the near operator. (Row IV) Images in which TECs were found between the two operators. (Row V) Images in which TECs were beyond the far operator. As indicated in the figure, images for RNAP in zone V were not detected for looped O2‐O1 DNA and unlooped Os‐O1 DNA. Note that nascent RNA associated with each TEC is visible, especially in the first column (insets), and increases in size as the RNAP progresses (I to V).
