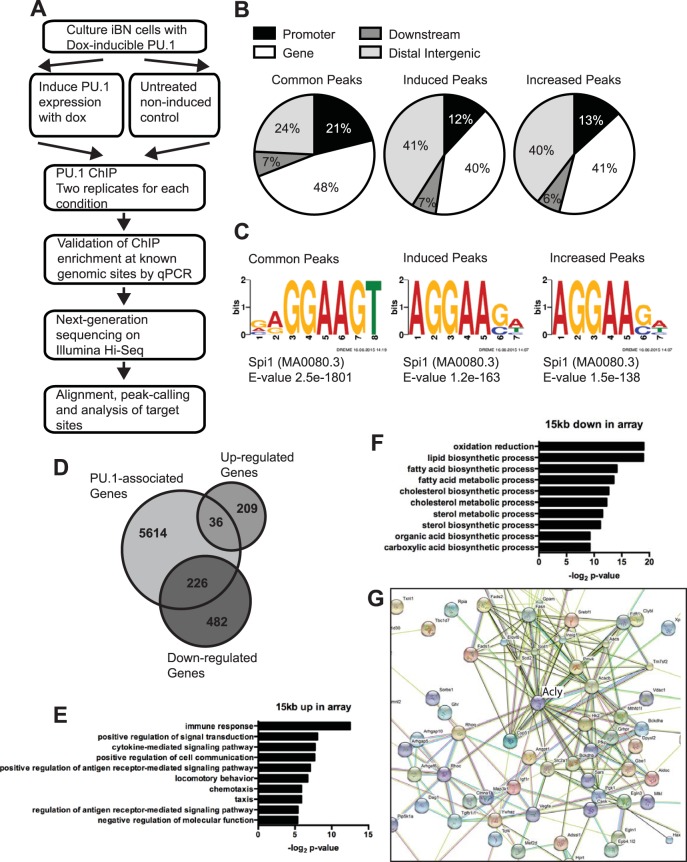
FIG 2.
Genome-wide analysis of induced PU.1 binding sites in iBN cells. (A) Workflow for generating ChIP sequencing data. (B) Distribution of ChIP-seq peaks within the genome. PU.1 peaks were divided into common peaks (PU.1-associated genomic regions that did not change upon PU.1 induction), induced peaks (genomic regions that acquired PU.1 association upon PU.1 induction), and increased peaks (genomic regions that were more highly associated with PU.1 upon induction). (C) DNA sequence motifs associated with genomic regions containing common peaks, induced peaks, or increased peaks, as indicated. (D) Venn diagram showing overlap of PU.1-associated genes with genes whose mRNA levels were either up- or downregulated as determined by microarray analysis. (E) Biological pathway analysis of 36 upregulated mRNAs associated with PU.1 peaks. (F) Biological pathway analysis of 226 downregulated mRNAs associated with PU.1 peaks. (G) Functional protein association analysis of PU.1-downregulated genes. STRING was used to integrate proteins encoded by 226 downregulated mRNAs associated with PU.1 peaks.

