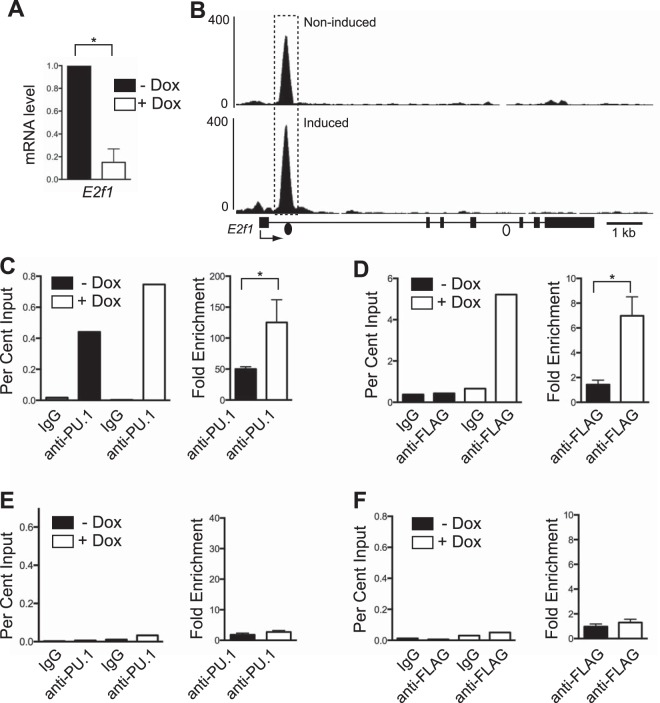
FIG 5.
Reduction of E2f1 mRNA transcripts is associated with increased PU.1 binding. (A) Induction of PU.1 expression in iBN cells decreases E2f1 mRNA transcript levels. E2f1 mRNA transcript levels were determined using RT-qPCR of RNA prepared 72 h after induction with 1,000 ng/ml Dox. (B) PU.1 association with a site in E2f1 intron 1 is inducible. Shown are ChIP-seq tracks without (−) and with (+) Dox 72 h after PU.1 induction. The E2f1 gene structure is shown below the bottom panel; boxes represent exons. The dashed box indicates a site of increased PU.1 association. Filled and open dots below the bottom panel indicate locations of primer pairs used for ChIP-qPCR analysis. (C) Quantification of PU.1 association with E2f1 intron 1. Anti-PU.1 ChIP was performed 72 h after Dox induction. The left panel shows percent input determined by qPCR using primers (represented by the filled dot in panel B) recognizing the E2f1 intron 1. The right panel shows fold enrichment comparing percent input from anti-PU.1 to that of IgG ChIP for three biological replicates. (D) Quantification of PU.1 association with E2f1 intron 1 using anti-FLAG ChIP performed 72 h after Dox induction. The left panel shows percent input determined by qPCR using primers recognizing E2f1 intron 1. The right panel shows fold enrichment comparing percent input from anti-FLAG to that of IgG ChIP for three biological replicates. (E and F) Quantification of PU.1 association with a negative-control site within E2f1 intron 4. Anti-PU.1 ChIP or anti-FLAG ChIP was performed 72 h after Dox induction. The left panels show percent input determined by qPCR using primers (represented by the open dot in panel B) recognizing E2f1 intron 4. The right panels show fold enrichment comparing percent input from anti-PU.1 to that of IgG ChIP for three biological replicates. *, P < 0.05.

