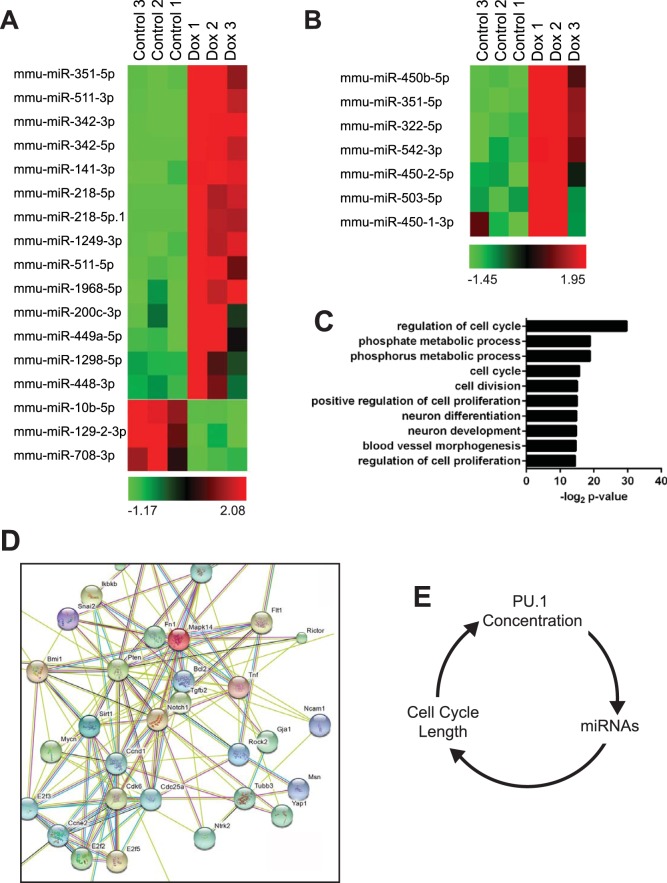
FIG 8.
Analysis of microRNAs induced by PU.1 using miRNA-seq (A) Expression of miRNAs induced or repressed ≥2-fold 72 h after PU.1 induction in iBN cells using 1,000 ng/ml Dox. (B) Heat map showing quantification of miRNAs in the miR-322 cluster. (C) Biological pathway analysis of validated miRNA targets. Validated targets of significantly induced miRNAs were associated with the biological pathways shown on the y axis. (D) Functional protein association analysis of validated genes regulated by PU.1-induced miRNAs. STRING was used to integrate proteins encoded by 49 genes regulated by PU.1-induced miRNAs. (E) Model for the interaction between PU.1 concentration, expression of miRNAs, and cell cycle length to regulate cell cycle progression in the myeloid lineage. mmu, Mus musculus.

