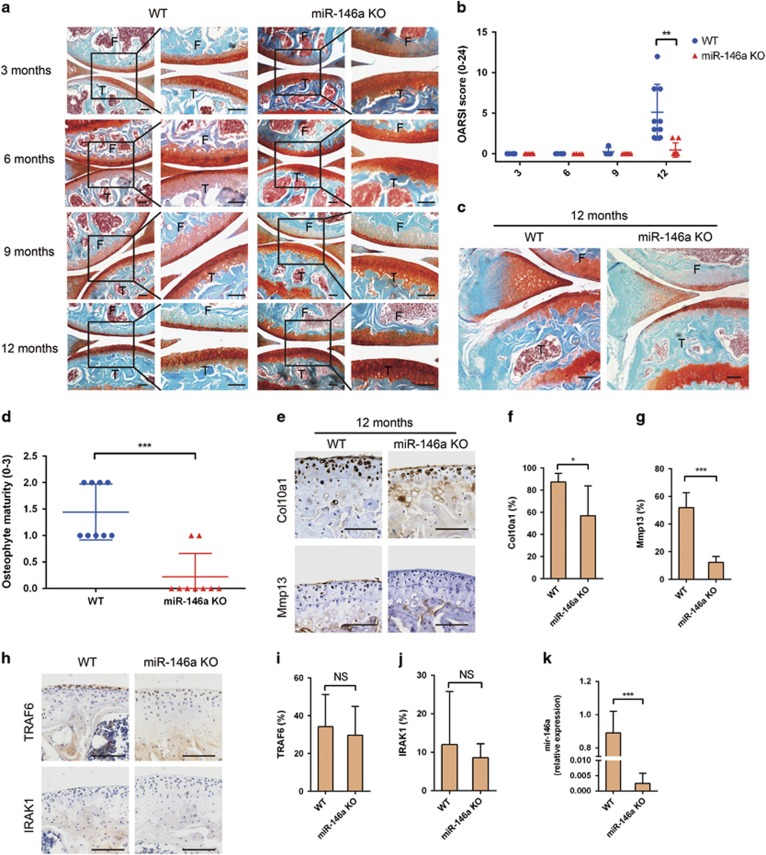
Figure 1.
Genetic deletion of miR-146a suppresses spontaneous OA. (a and b) Safranin O and fast green staining (a) or OARSI scores (b) of knee joint cartilage harvested from 3-month-old mice (WT, n=8; miR-146a KO, n=8), 6-month-old mice (WT, n=4; miR-146a KO, n=9), 9-month-old mice (WT, n=4; miR-146a KO, n=8) and 12-month-old mice (WT, n=9; miR-146a KO, n=9). Cartilage (red), bone (blue); F, femur; T, tibia. Scale bars, 100 μm. (c and d) Safranin O staining and quantification of osteophyte formation in the medial tibial plateau of 12-month-old WT and miR-146a KO mice (WT, n=9; miR-146a KO, n=9). Scale bars, 100 μm. (e-g) Immunohistochemical staining and quantitative analysis of the percentage of Col10a1 and Mmp13-positive chondrocytes (both stained brown) in articular cartilage harvested from 12-month-old mice (WT, n=9; miR-146a KO, n=9) as described in Materials and Methods section. Sections were counterstained with hematoxylin, nucleus (blue). Scale bars, 100 μm. (h-j) Immunohistochemical staining and quantitative analysis of IRAK1 and TRAF6 in knee joint cartilage harvested from 12-month-old mice (WT, n=9; miR-146a KO, n=9). (k) qPCR analysis of miR-146a levels in articular cartilage of 3-month-old mice. (WT, n=4; miR-146a KO, n=4). Data are mean±S.D. *P<0.05, **P<0.01, ***P<0.001 versus WT group (Mann-Whitney test) in b, d, f, g, i, j and k. NS, not significant between the indicated groups

