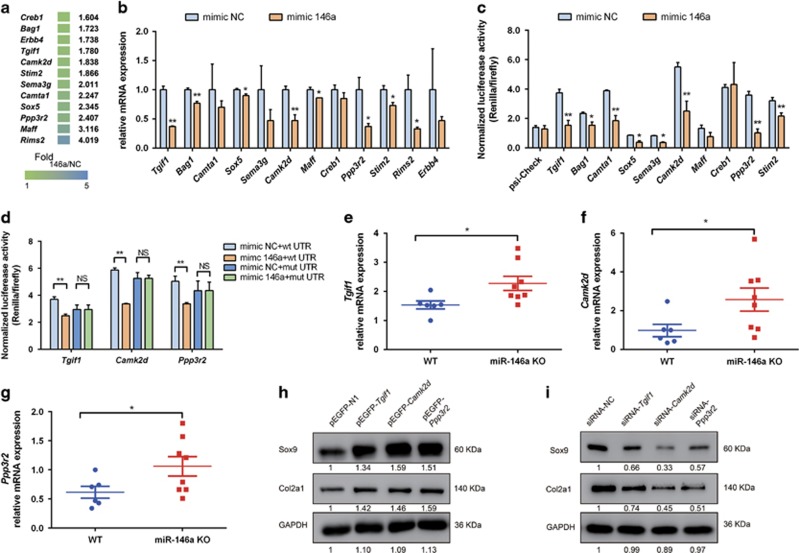
Figure 4.
MiR-146a targets Tgif1, Camk2d and Ppp3r2. (a) Total RNA of mouse articular chondrocytes transfected with miR-146a inhibitor or control (NC) inhibitor was used for microarray analysis. Twelve genes were validated based on the seed region of miR-146a in 3′-UTR of candidate gene that is evolutionarily conserved in mammals. The gradient colors and numbers indicate fold change of gene expression in mouse chondrocytes transfected with the miR-146a inhibitor compared with control, as determined by microarray. Fold 146a/NC, fold change of gene expression in mouse chondrocytes transfected with miR-146a inhibitor compared with control inhibitor. (b) qPCR analysis of mRNA expression of candidate target genes in mouse articular chondrocytes transfected with miR-146a mimic or control mimic plasmid (n=3 for each treatment). (c and d) Luciferase activity analysis in HEK293T cells that were co-transfected with the indicated 3′-UTR reporter (c) or with the indicated WT or mutant 3′-UTR reporter (d) along with miR-146a mimic or control mimic plasmid (n=3 for each treatment). The results were normalized by internal firefly luciferase readout. (e-g) qPCR analysis of mRNA expression of Tgif1 (e), Camk2d (f) and Ppp3r2 (g) in articular cartilage of mice (WT, n=6; miR-146a KO, n=8) collected at 4 weeks after DMM surgery. (h and i) Western blot analysis of endogenous Sox9 and Col2a1 protein expression in mouse chondrocytes that were transfected with indicated expression vector constructs (h) or with gene-specific siRNAs as well as a scrambled control siRNA (siRNA-NC). For quantification, protein expression was normalized by the protein amount in the first lane. (i) Three independent experiments were performed with similar results in b-d. Relative mRNA expression was normalized to the expression of GAPDH. Data are mean±S.D. *P<0.05, **P<0.01 versus control group (Student's t-test) in b, c and d and Mann–Whitney test in e-g. NS, not significant between the indicated groups

