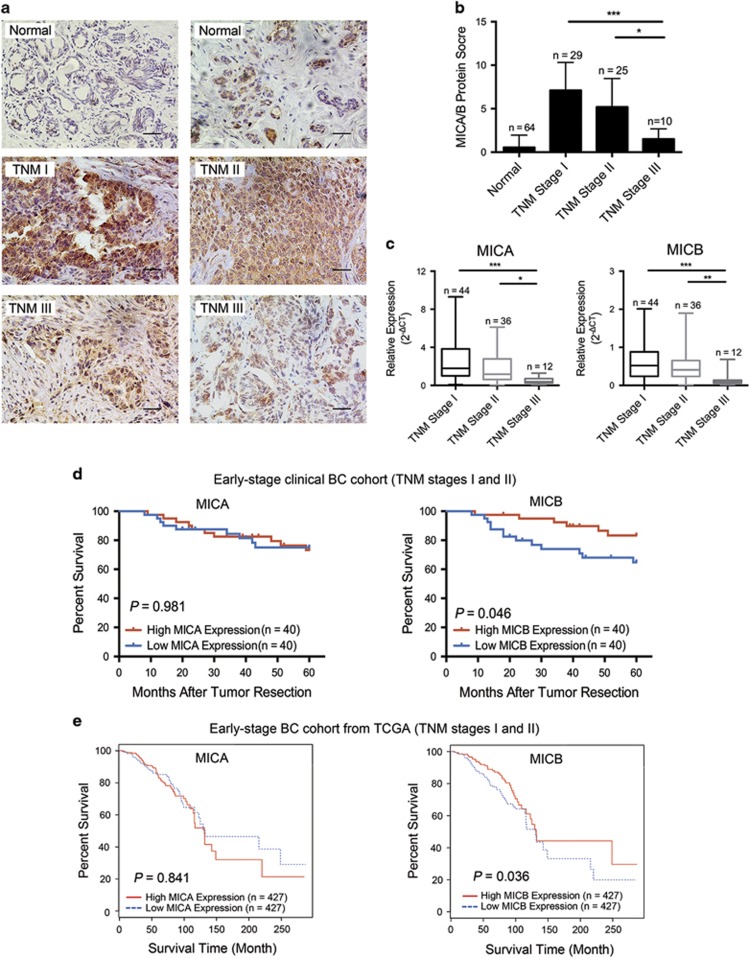
Figure 1.
Clinical significance of the MICA/B expression profile in BC tissues. (a) Representative Immunohistochemistry (IHC) staining results for MICA/B expression in normal breast tissues and BC tissues with different TNM stages. (b) IHC scores of MICA/B in BC tissues were inversely associated with the TNM stage. (c) Quantitative PCR analysis. MICA (left) and MICB (right) mRNA expression levels were inversely associated with the TNM stage in BC tissues. (d) Kaplan–Meier survival curves of early-stage BC patients (TNM stages I and II) with different MICA (left) or MICB (right) expression levels (N=40 for each group). (e) Kaplan–Meier survival curves of early-stage BC cohort from TCGA (TNM stages I and II) with different MICA (left) or MICB (right) expression levels (N=427 for each group). *P<0.05, **P<0.01, *** P<0.001

