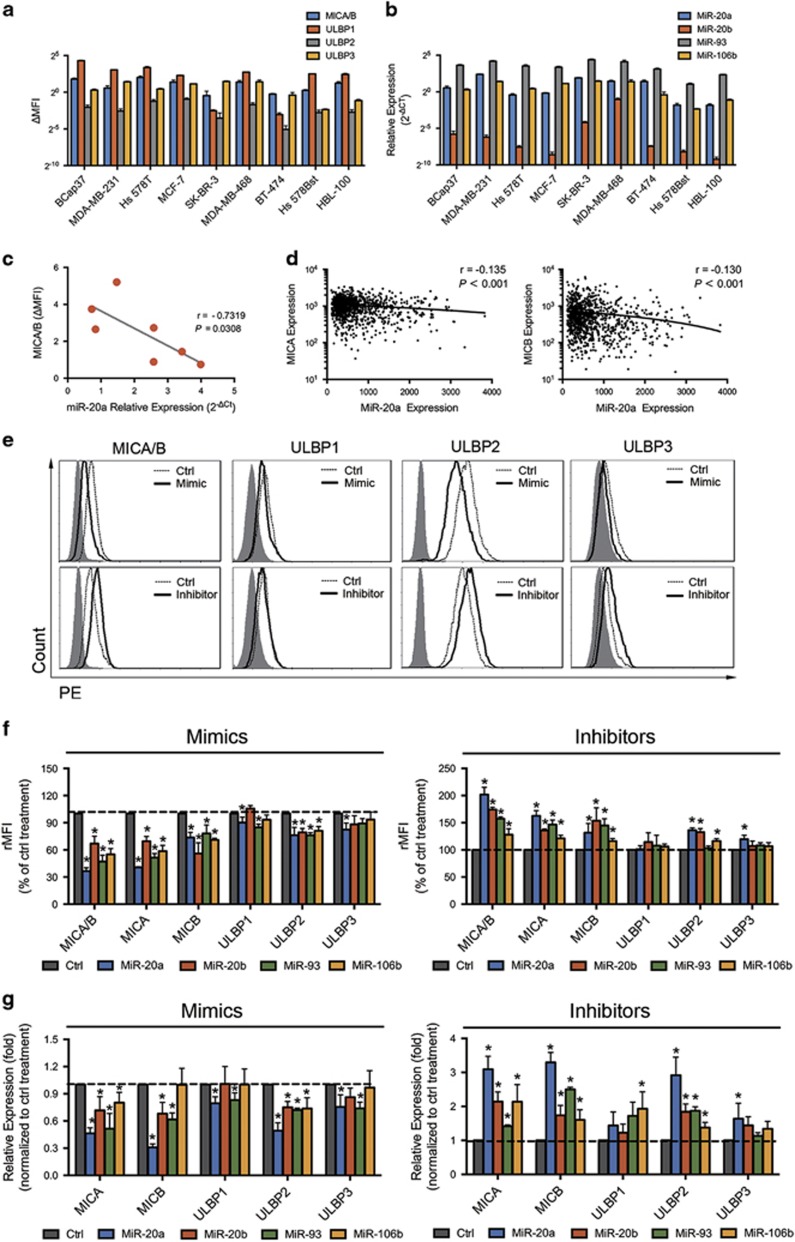
Figure 2.
MicroRNAs specifically downregulate MICA/B and ULBP2 expression in BC cells. (a) The NKG2DL expression levels of seven human BC cell lines (BCap37, MDA-MB-231, Hs 578T, MCF-7, SK-BR-3, MDA-MB-468 and BT-474) and two normal breast cell lines (HBL-100 and Hs 578Bst) were assessed by flow cytometry analysis. (b) The miR-20a, miR-20b, miR-93 and miR-106b expression levels of the abovementioned cell lines were detected with quantitative PCR analysis. (c) Statistical analysis revealed a significant inverse correlation between the expression levels of miR-20a and MICA/B surface molecules in the seven BC cell lines. (d) Statistical analysis revealed an inverse correlation between the expression levels of miR-20a and MICA (left) or MICB (right) mRNA in TCGA's BC cohort (N=1042). (e), (f) and (g) BCap37 cells were exposed to control miRNAs (Ctrl), 50 nM mimics or inhibitors of specific miRNA for 24 h, respectively. The expression levels of NKG2DLs were detected 72 h after transfection. (e) Representative flow cytometry results showing that miR-20a inversely regulated the protein expression levels of MICA/B and ULBP2. (f) Flow cytometry analysis. The four tested miRNAs inversely regulated the protein expression levels of MICA/B and ULBP2. The relative MFIs (rMFIs) of NKG2DLs were calculated as follows: (ΔMFI of specific treatment/ΔMFI of control treatment) × 100%. (g) Quantitative PCR analysis. The four tested miRNAs inversely regulated the mRNA expression levels of MICA/B and ULBP2. Error bars represent the S.D. obtained from three independent experiments. *P<0.05

