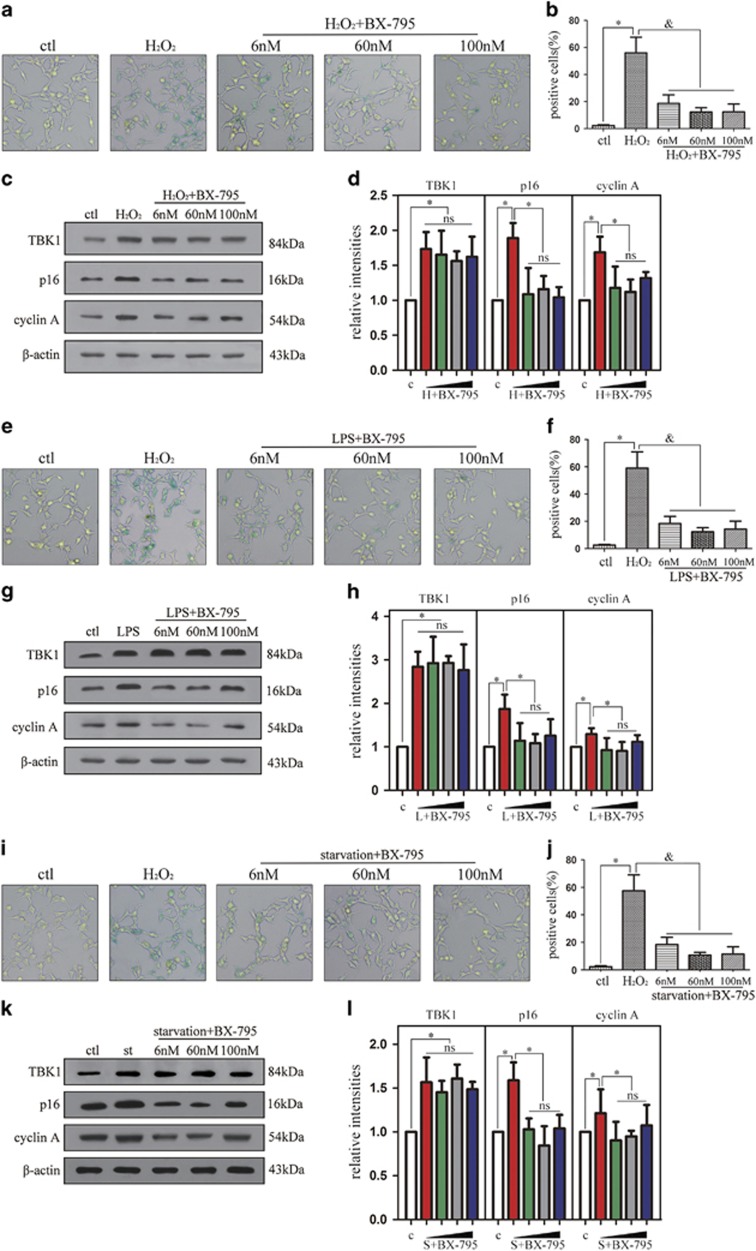
Figure 4.
The effect of BX-795 on p16 expression and cell senescence in vitro. (a) Representative β-gal staining images showing the effect of BX-795 on cell senescence after H2O2 (100 μM) stimulation 60 min in HEK293. (b) Statistical analysis of the data shown in (a).The data are expressed as the means±s.e.m.. from three independent experiments, *P<0.05 versus control, &P<0.05 versus H2O2. (c) Western blot showing the effect of BX-795 on p16 and cyclin A expression after H2O2 (100 μM) stimulation 60 min in HEK293. (d) Statistical analysis of the data shown in (c). The data are expressed as the means±s.e.m. from three independent experiments, *P<0.05 versus control, &P<0.05 versus H2O2. (e) Representative β-gal staining images showing the effect of BX-795 on cell senescence after LPS (1 μg/ml) stimulation 90 min in HEK293. (f) Statistical analysis of the data shown in (e).The data are expressed as the means±s.e.m. from three independent experiments, *P<0.05 versus control, &P<0.05 versus LPS. (g) Western blot showing the effect of BX-795 on p16 and cyclin A expression after LPS (1 μg/ml) stimulation 90 min in HEK293. (h) Statistical analysis of the data shown in (g). The data are expressed as the means±s.e.m. from three independent experiments, *P<0.05 versus control, &P<0.05 versus LPS. (i) Representative β-gal staining images showing the effect of BX-795 on cell senescence after starvation in HEK293. (j) Statistical analysis of the data shown in (i).The data are expressed as the means±s.e.m. from three independent experiments, *P<0.05 versus control, &P<0.05 versus starvation. (k) Western blot showing the effect of BX-795 on p16 and cyclin A expression after starvation stimulation. (l) Statistical analysis of the data shown in (k). The data are expressed as the means±s.e.m. from three independent experiments, *P<0.05 versus control, &P<0.05 versus starvation

