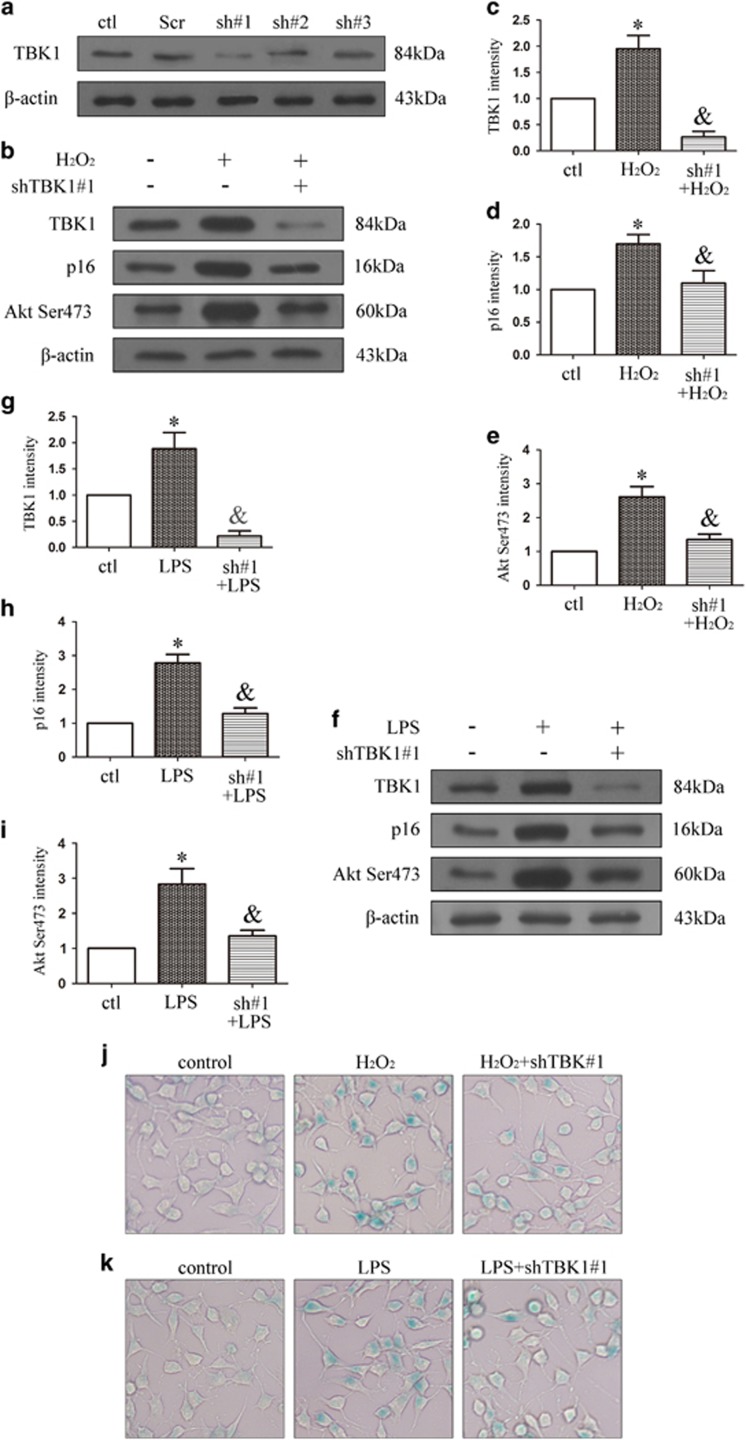
Figure 7.
The effect of TBK1 shRNA on p16 expression and cell senescence in vitro. (a) Western blot showing the effect of TBK1 shRNAs on TBK1 expression in N2a. (b) Western blot showing the effect of TBK1 shRNA#1 on p16 and Akt Ser473 expression after H2O2 (100 μM) stimulation 60 min in N2a. (c-e) Statistical analysis of the data shown in (b).The data are expressed as the means±s.e.m. from three independent experiments, *P<0.05 versus control, &P<0.05 versus H2O2. (f) Western blot showing the effect of TBK1 shRNA#1 on p16 and Akt Ser473 expression after LPS (1 μg/ml) stimulation 90 min in N2a. (g-i) Statistical analysis of the data shown in (f).The data are expressed as the means±s.e.m. from three independent experiments, *P<0.05 versus control, &P<0.05 versus LPS. (j-k) Representative β-gal staining images showing the effect of TBK1 shRNA#1 on N2a cell senescence

