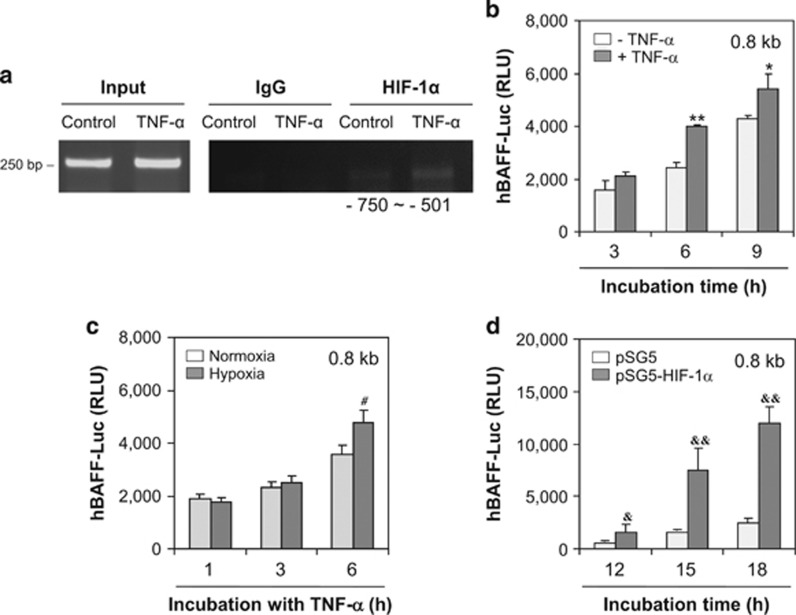
Figure 6.
hBAFF expression was enhanced by HIF-1α binding in between −750 and −501 bp of hBAFF promoter. (a) MH7A cells were stimulated with TNF-α and fixed with 1% formaldehyde. Their chromatin extracts were immunoprecipitated with anti-HIF-1α antibodies. DNA fragments were subjected to PCR analysis using primer sets spanning the promoter regions. Sequences for primer set were 5′-TTTTCCTTAAAAATATATTC-3′ (forward) and 5′-GTGAAGGTCAGATAAGCT-3′ (reverse). Primer set corresponds to −750 to −501 bp including HIF-1α binding site (−693 to −688 bp) on hBAFF promoter. (b–d) The 0.8 kb pGL3-hBAFF-Luc plasmids were prepared by the deletion of 200 bp from 5′-end of 1.0 kb hBAFF promoter. The MH7A cells were transfected with 0.8 kb pGL3-hBAFF-Luc plasmid (b and c). Then, the cells were incubated in the presence or absence of TNF-α for 6 h (b), or under hypoxic condition (c). The 0.8 kb pGL3-hBAFF-Luc and pSG5-HIF-1α plasmids were co-transfected into MH7A (d). Luciferase activity of hBAFF promoter was measured by using luminometer. Data were the representative of four experiments. Data in the bar graph represent the means±S.E.M. *P<0.05; **P<0.01, significant difference as compared with TNF-α-untreated control at each time point (b). #P<0.05, significant difference as compared with control under normoxia condition at each time point (c). &P<0.05; &&P<0.01, significant difference as compared with pSG5 plasmid-transfected control at each time point (d)

