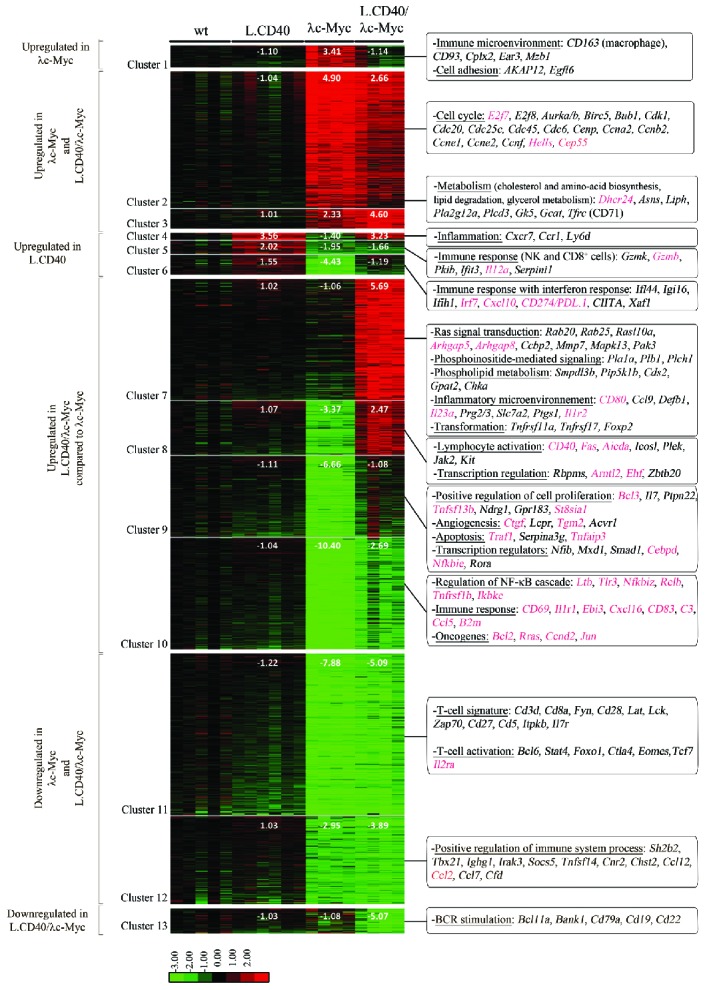
Figure 7.

Gene expression profile of L.CD40/λc-Myc tumors compared to λc-Myc mice tumors. Supervised analysis led to the selection of 2,437 significant probes, which were initially partitioned into 30 clusters by K-means clustering so that the number of probes was above 15. The closest groups were merged 2 by 2 according to their proximity by hierarchical clustering and principal component analysis of the mean vectors. This was repeated until maximization of the absolute value of χ2.19 The final resulting number of clusters was 13 (Cluster 1 to 13). For each cluster and each sample condition, fold change value compared to wild-type (wt) samples were calculated from the mean of gene expression values and are indicated on the heat map. Most representative functions with most significant genes are mentioned on the right. NF-κB target genes are indicated in red. Log2 value color codes are shown beside the heat map. NF-κB: nuclear factor-κB; BCR: B-cell receptor.
