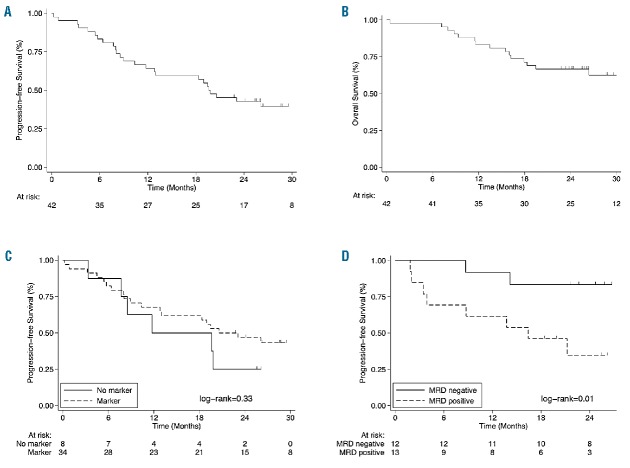
Figure 1.
Kaplan-Meier curves. (A) Progression-free survival (PFS) in the intention-to-treat (ITT) population (n=42). (B) Overall survival (OS) in the ITT population (n=42). (C) PFS in the ITT population, stratified by availability of a molecular marker of minimal residual disease (MRD). (D) PFS in the subgroup of patients (n=25) who were evaluable for MRD at the end of the induction phase, stratified on the basis of allele-specific oligonucleotide nested polymerase chain reaction MRD evaluations of bone marrow samples.

