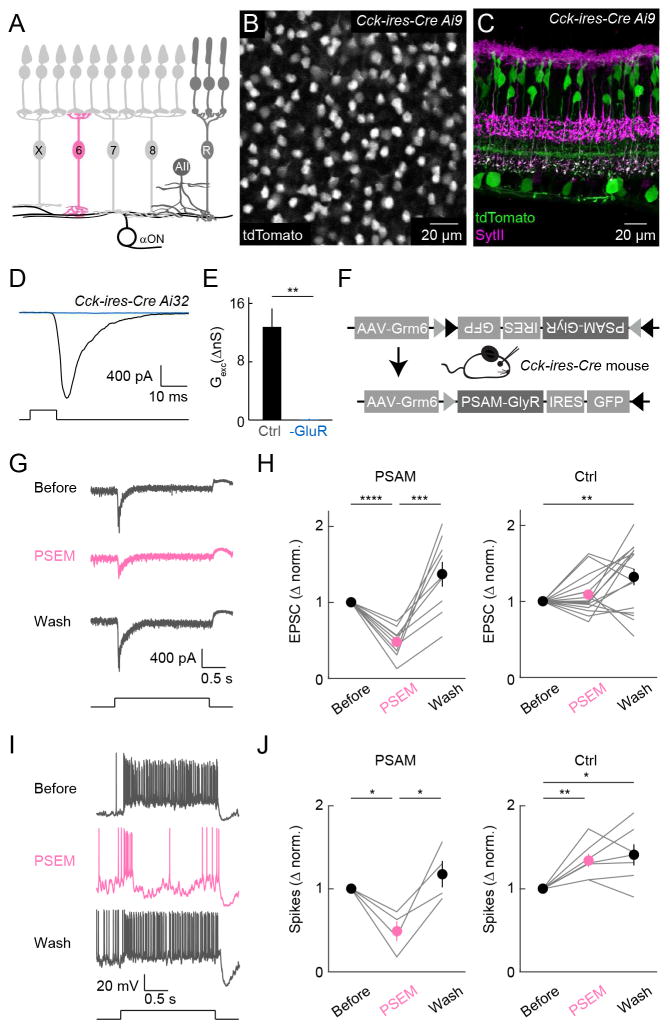
Figure 1. B6 cells provide dominant excitatory input to ONα-RGCs.
(A) Schematic illustrating converging bipolar cell input to ONα-RGCs. X, 6, 7, and 8 refer to cone bipolar cell types (Euler et al., 2014), whereas R indicates rod bipolar cells, which in wild-type mice provide mostly indirect input via AII amacrine cells (AII) and cone bipolar cells to ONα-RGCs. (B) Distribution of tdTomato-expressing cells in the inner nuclear layer of a P21 whole-mount Cck-ires-Cre Ai9 retina. (C) Vibratome section of a P21Cck-ires-Cre Ai9 retina showing tdTomato expression in some amacrine cells, RGCs, and B6 cells. The latter is confirmed by immunostaining of synaptotagmin II (SytII), an axonal marker of B2 and B6 cells. (D and E) Representative EPSC traces (D) and summary data of excitatory conductances (E) of ONα-RGCs elicited by optogenetic stimulation of B6 cells in the absence (black) or presence (blue) of AMPA and NMDA receptor antagonists (Ctrl: 12.81 ± 2.54 nS, -GluR: : 0.08 ± 0.11 nS, n = 8, p = 0.002). L-AP4, ACET and hexamethonium were included in the bath all the time. (F) Schematic of the AAV virus injected for pharmacogenetic silencing experiments. (G and I) Representative EPSC traces (G) and spike responses (I) of ONα-RGCs in AAV-Grm6S-PSAMcon injected retinas before (Before), during (PSEM) and after (Wash) the addition of PSEM308. (H and J) Summary data of excitatory conductances (H) and spike responses (J) of ONα-RGCs with (PSAM) or without (Ctrl) AAV-Grm6S-PSAMcon injection before (Before), during (PSEM) and after (Wash) the addition of PSEM308. Circles (error bar) indicate mean (±SEM) of respective population. In (H), PSAM: PSEM 0.479 ± 0.064 (mean ± SEM); Wash 1.370 ± 0.163; Before vs PSEM p = 4 *10−5; PSEM vs Wash p = 5 *10−4; Before vs Wash p = 0.053. In (H), Control: PSEM 1.088 ± 0.064; Wash 1.321 ± 0.108; Before vs PSEM p = 0.19; PSEM vs Wash p = 0.068; Before vs Wash p = 0.009. In (J), PSAM: PSEM 0.489 ± 0.121; Wash 1.177 ± 0.160; Before vs PSEM p = 0.02; PSEM vs Wash p = 0.03; Before vs Wash p = 0.349. In (J), Control: PSEM 1.343 ± 0.081; Wash 1.409 ± 0.127; Before vs PSEM p = 0.006; PSEM vs Wash p = 0.53; Before vs Wash p = 0.02.

