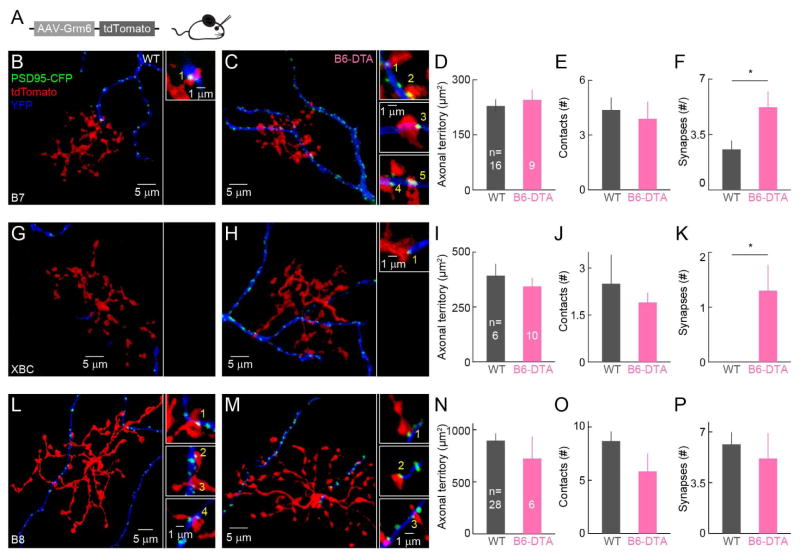
Figure 4. Cell-type-specific rewiring of cone bipolar cells with ONα-RGCs following B6 cell removal.
(A) Schematic of AAV-Grm6S-tdTomato injection to sparsely label ON bipolar cells. (B and C) Examples of isolated B7 – ONα-RGC pairs in wild-type (B) and B6-DTA (C) retinas. Maximum intensity projections of confocal image stacks are shown on the left. The panels on the right show single planes from the image stacks at contact points between B7 cell axons (red) and ONα-RGC dendrites (blue). Synapses were identified by PSD95 puncta (green). (D–F) Summary data for axon territories (D), axo-dendritic contacts (E) and synapse numbers (F) for B7 – ONα-RGC pairs in wild-type (grey) and B6-DTA (pink) retinas. In (D), WT: 229 ± 18 μm2 (mean ± SEM); B6-DTA: 245 ± 28 μm2; p = 0.63. In (E), WT: 4.38 ± 0.68; B6-DTA: 3.89 ± 0.93; p = 0.68. In (F), WT: 2.56 ± 0.56; B6-DTA: 5.22 ± 0.98; p < 0.05. (G–K) Analogous to B and C (G and H) and D–F (I–K) but for XBC – ONα-RGC pairs. In (I), WT: 393 ± 54μm2; B6-DTA: 344 ± 38 μm2; p = 0.47. In (J), WT: 2.50 ± 0.92; B6-DTA: 1.90 ± 0.31; p = 0.56. In (K), WT: 0.00 ± 0.00; B6-DTA: 1.30 ± 0.47; p = 0.02. (L–P) Analogous to B and C (L and M) and D–F (N–P) but for B8 – ONα-RGC pairs. In (N), WT: 897 ± 210 μm2; B6-DTA: 724 ± 210 μm2; p = 0.47. In (O), WT: 8.68 ± 0.9; B6- DTA: 5.83 ± 1.66; p = 0.17. In (P), WT: 6.14 ± 0.84; B6-DTA: 5.17 ± 1.74; p = 0.63.

