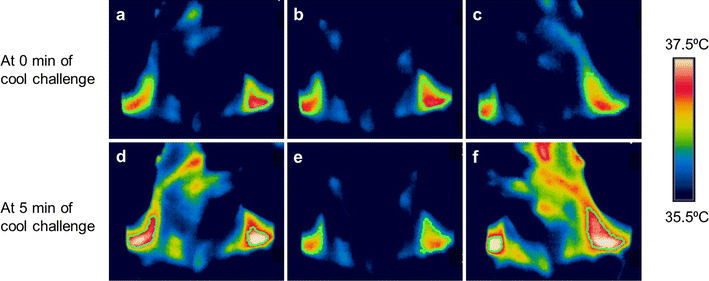
Fig. 3.

Thermal images of cold-induced BAT activity. Representative images taken at 0 min (a, b, c) and 5 min (d, e, f) of cold challenge, showing an increase in the area and temperature of the thermally active region. The subject’s head was turned to his left in a and d, was facing forward in b and e, and turned to his right in c and f. Green contour lines circumscribe the ROIs over the C-SCV regions, white pixels >37.4 °C, red pixels 36.8–37.4 °C; yellow pixels, 36.5–36.8 °C. Color figure online
