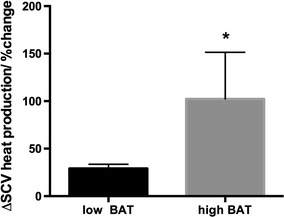
Fig. 4.

Effect of cold challenge on heat production in the C-SCV region in low-BAT and high-BAT groups (see footnote to Table 1 for definition of groups). Asterisk indicates significant difference from low-BAT group by Student’s t test at p < 0.05. Values are shown as the mean ± standard error (SE)
