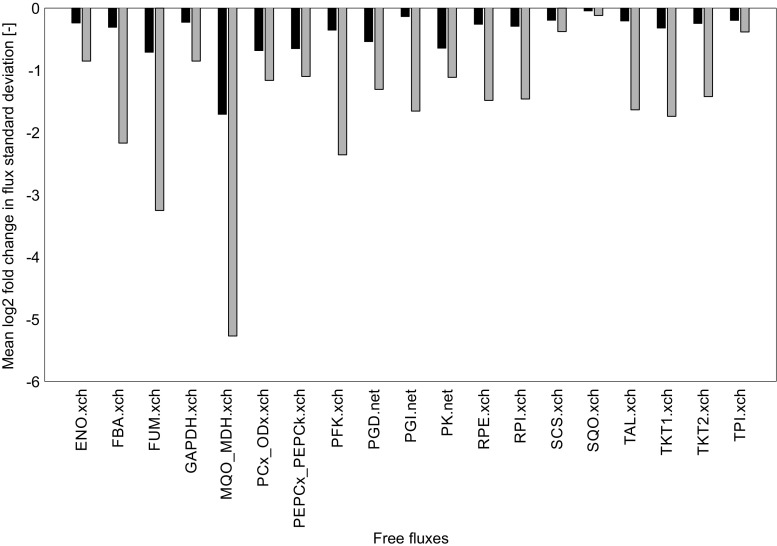
Fig. 2.
Relative flux standard deviations for all free fluxes in comparison to the measurement scenario described in Kappelmann et al. [58]. Black bars represent the measurement scenario of higher acquisition precision for MID than for TMID, whereas gray bars represent the scenario of equal measurement precision for MID and TMID. The flux nomenclature can be found in Kappelmann et al. [58]

