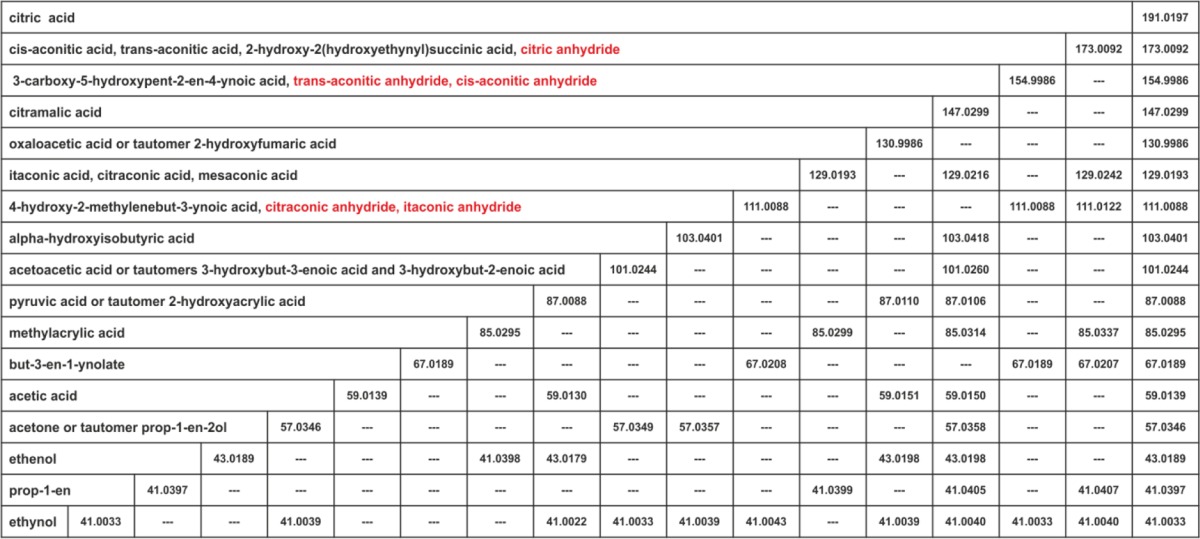
Table 3.
Schematic of the fragmentation pathway of Cit using structure names. In each column the fragment ions of the corresponding metabolite appear, ordered by mass. A presumed intermediate structure was assumed to be correct if it only generated product ions also present in the product ion spectrum of Cit itself. The fragments apparent in the product ion spectrum of Cit are listed in the rightmost column. In the leftmost column chemically plausible structures for each product ion Cit are given which are consistent with the labeling data of Electronic Supplementary Material S6. The red colored ones are excluded based on other evidence (see main text). The shown masses are experimental accurate masses from the respective injection.

