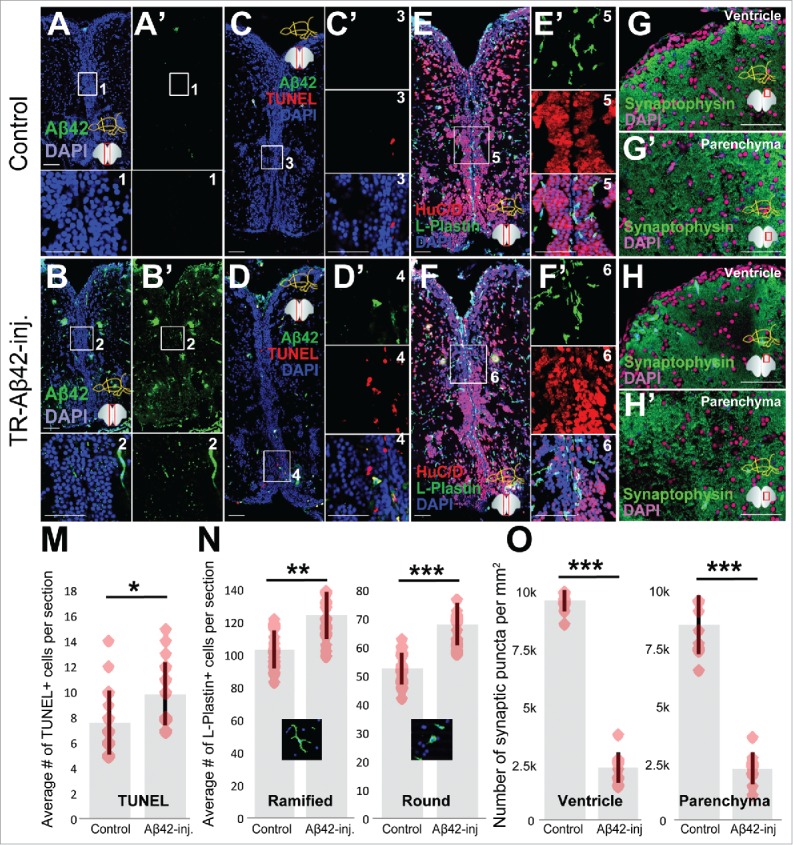
Figure 1.

Aβ42 accumulation leads to neurodegeneration phenotypes in old adult zebrafish brain. Aβ42 immunostaining in control (A) and TR-Aβ42-injected brains (B). Insets are magnified images of the boxes. TUNEL detection of apoptotic cells in control (C) and TR-Aβ42-injected brains (D). C’ and D’ are single fluorescent channels of the boxes. Immunostaining for HuC/D (neurons, red) and L-Plastin (macrophages/microglia, green) in control (E) and TR-Aβ42-injected brains (F). E’ and F’ are single fluorescent channels of the boxes in corresponding panels. Synaptophysin immunostaining in ventricular region in control (G), parenchyma of control (G’), ventricular region of TR-Aβ42-injected (H) and parenchyma of TR-Aβ42-injected brain (H’). Quantification graphs for TUNEL (M), L-Plastin (N) and Synaptophysin (O). Data shown as mean ± s.e.m.Red dots are individual data points as an overlaid scatter plot. Representative morphologies of microglia are shown in N at each category. All stainings were performed at 3 d after injection. Scale bars equal 50 μm. n = 3 fish, and 18 sections in total for every staining.
