
Figure 3.
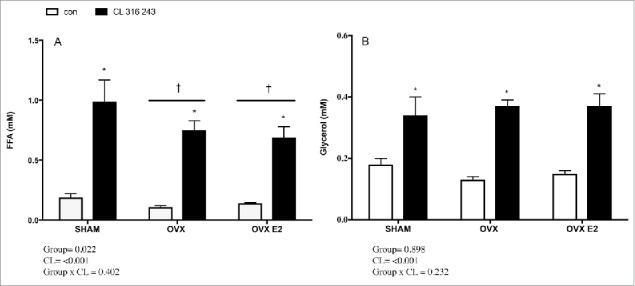
Serum FFA (A) and glycerol (B) concentrations in control or CL 316, 243 treated rats. Data are presented as mean ± SEM; n = 6 for control and CL groups in SHAM, OVX and OVX E2 groups. Statistical significance is accepted at p < 0.05; * denotes significant Treatment (CL) effect compared with own control (ie. SHAM CL vs. SHAM con); † denotes significant group effect compared with SHAM control.