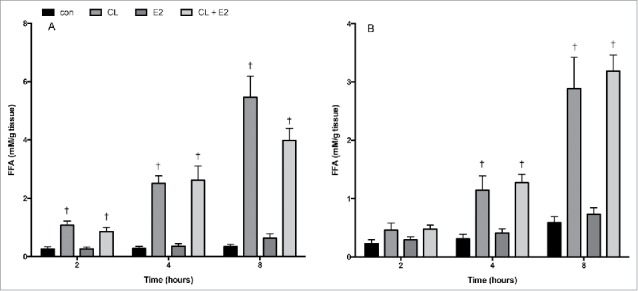
Figure 7.

Time course of FFA release in control or CL 316,243 treated adipose fragments. Adipose tissue harvested from r.p. (A) and iWAT (B) were treated ex vivo with CL (1 uM), E2 (10 nM), or CL + E2 (1 uM + 10 nM) for 2, 4 and 8 hrs. Data are presented as mean ± SEM; n = 6 for control and CL groups in SHAM, OVX and OVX E2 groups. Statistical significance is accepted at p < 0.05; † denotes significant difference compared with control at specific time point.
