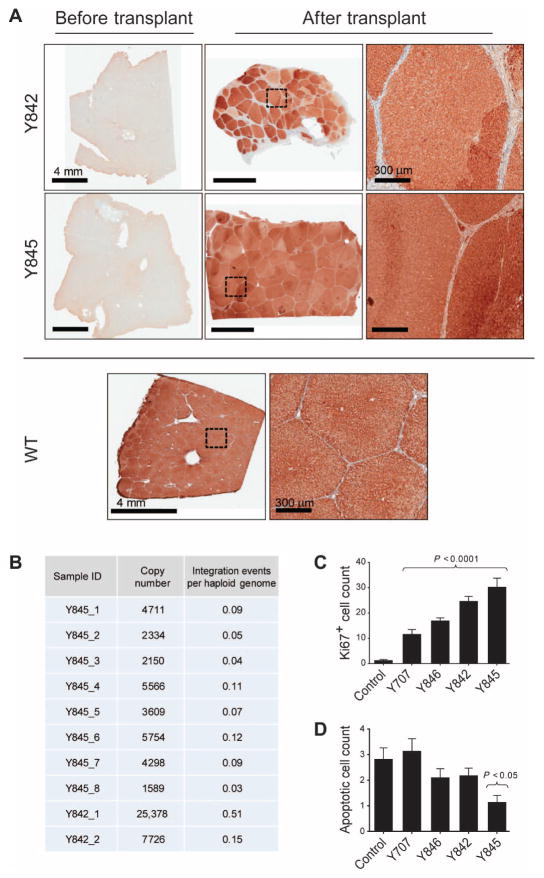
Fig. 5. FAH+ hepatocytes completely repopulate the Fah−/− liver.
(A) Representative liver tissues from pigs Y842 and Y845 stained for FAH at the time of hepatectomy (left panels) and 12 months after transplantation with LV-Fah–transduced hepatocytes (middle and right panels). An age-matched, nontreated control WT pig is shown for comparison. High-magnification images of the regions outlined by dotted squares are provided. (B) DNA from eight different lobes from pig Y845 (1 to 8) and two biopsies from pig Y842 (1 and 2) were analyzed for integration of LV by qPCR. Total copies of integrated LV per 150 ng of genomic DNA were calculated based on a standard curve. The “integration events per haploid genome” were calculated based on the pig haploid genome size of 2800 Mb. (C) Ki67-positive nuclei were quantified by counting nuclei in 10 random sections per slide in paraffin-embedded tissue sections of pigs Y707, Y846, Y842, and Y845 and a control WT pig. Data are means ± SEM. P values versus control were determined using a two-tailed t test. (D) Hepatocyte apoptosis was quantified in three random paraffin-embedded tissue sections of pigs Y707, Y846, Y842, and Y845 and a control WT pig. Apoptotic nuclei were quantified by counting nuclei in 10 random 20× microscopic slides per tissue section. Data are means ± SEM, with statistical significance versus control determined using one-way analysis of variance (ANOVA), followed by Bonferroni’s multiple comparisons test.

