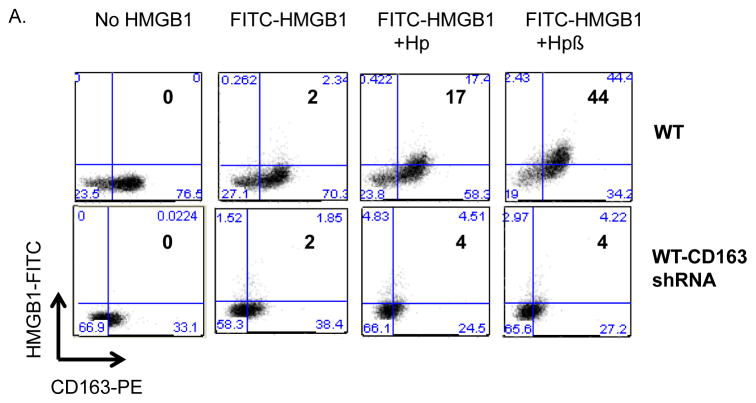
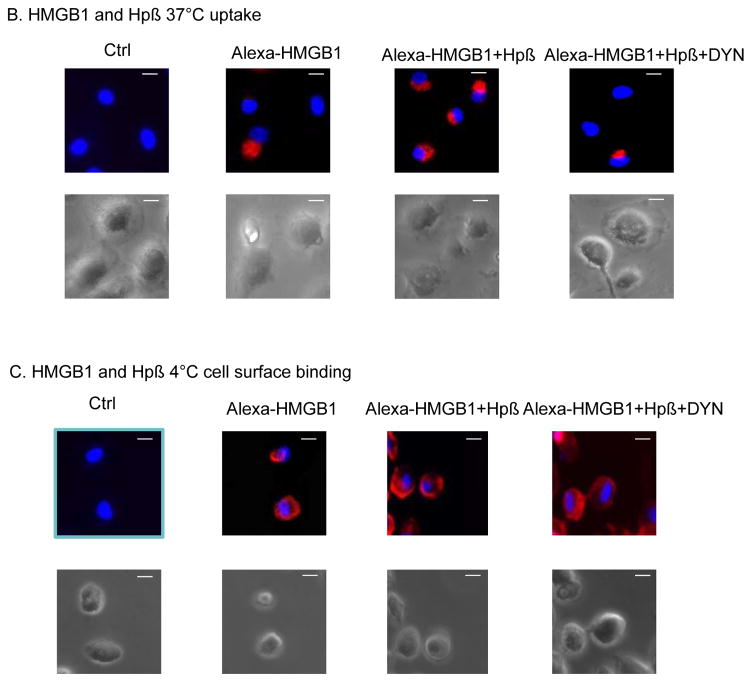
Figure 5. Uptake and cell surface binding of HMGB1 and haptoglobin (or β) complexes.
(A) The uptake of HMGB1 and haptoglobin (or haptoglobin β) complexes was measured by flow cytometry analysis. CD163 shRNA lentiviral or vector alone (WT) transduced primary human macrophages were incubated with FITC-labeled HMGB1 (1 μg/ml) plus haptoglobin (3 μg/ml) or haptoglobin β (1μg/ml) for 30 minutes. Uptake of FITC-HMGB1 was performed by staining for CD163 PE and FITC on cells. Data are representative from 5 separate experiments.
(B–C) Uptake or cell surface binding of HMGB1-haptoglobin β complexes. Human macrophages on cover slips were incubated with Alexa 555 labeled HMGB1 (red) alone or in complex with haptoglobin β for 2 hours at 37°C (B) or 4°C (C). Dynasore (DYN) was pre-incubated with cells for 30 min before the addition of HMGB1 and/or haptoglobin β. Endocytic uptake or cell surface binding of HMGB1 was visualized via Carl Zeiss fluorescence microscope. Nuclei were counterstained with DAPI (blue). Lower panel: Corresponding phase contrast image of cells. Scale bar = 10 μm. Data are representative from 6 independent experiments.


