
Figure 5.
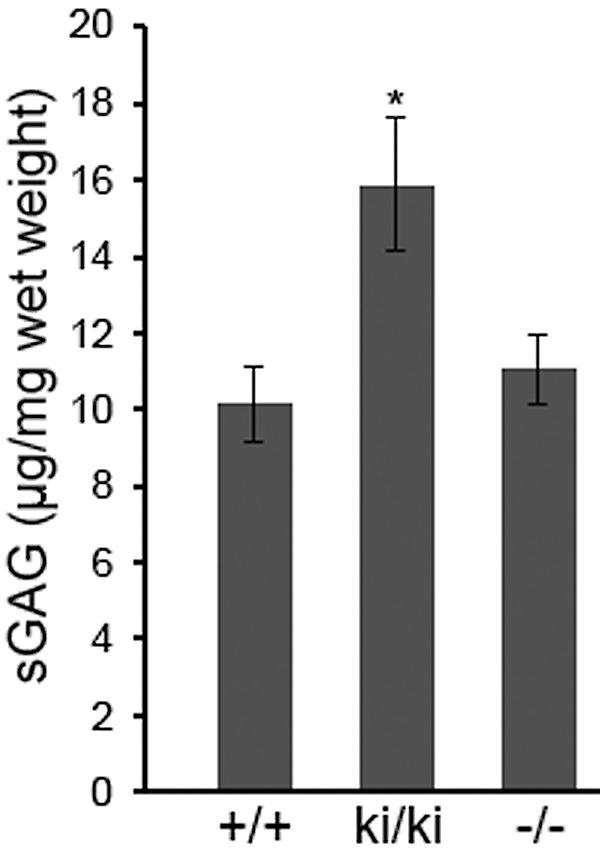
Total amount of sGAG of BrM/Ch samples from 9-month-old mice. Error bars indicate the mean ± SD. n = 5 mice per genotype. *P < 0.05 comparing to the value of Efemp1+/+ mice. +/+, Efemp1+/+; ki/ki, Efemp1ki/ki; −/−, Efemp1−/−.
Official websites use .gov
A
.gov website belongs to an official
government organization in the United States.
Secure .gov websites use HTTPS
A lock (
) or https:// means you've safely
connected to the .gov website. Share sensitive
information only on official, secure websites.
Total amount of sGAG of BrM/Ch samples from 9-month-old mice. Error bars indicate the mean ± SD. n = 5 mice per genotype. *P < 0.05 comparing to the value of Efemp1+/+ mice. +/+, Efemp1+/+; ki/ki, Efemp1ki/ki; −/−, Efemp1−/−.