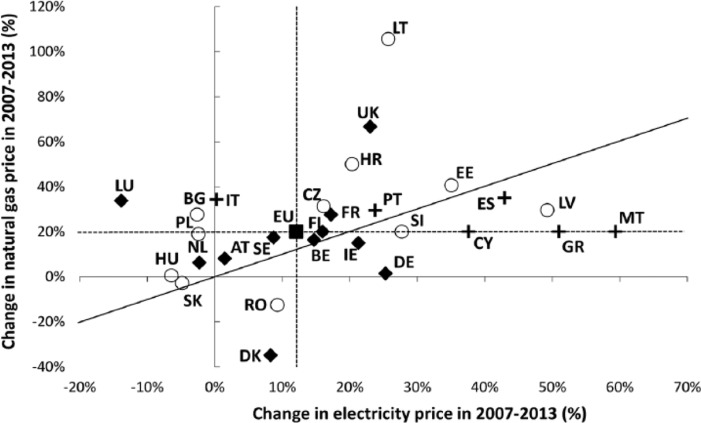
Figure 4.
Change in household natural gas prices versus change in household electricity prices (accumulated percentage, calculated on real prices denominated in national currency) of member states, that occurred between the years 2007 and 2013. Note: (1) no household natural gas prices data is available for Greece, Finland, Malta and Cyprus; for comparative purposes, they are displayed distinctly along the line representing the average natural gas price of the European Union; (2) the diagonal line indicates a theoretical line along which natural gas and electricity prices increase at the same rate.

