Figure 7.
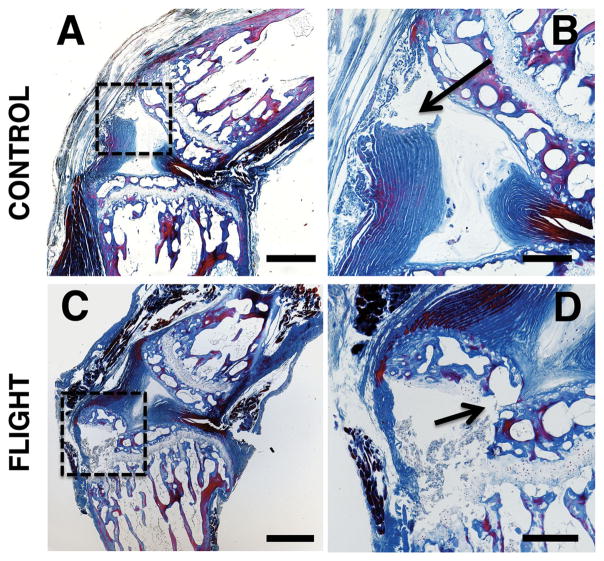
Representative histology images showing (A, B) failure at the endplate junction in control spinal segments and (C, D) failure in the growth plate and epiphyseal bone in post-flight spinal segments. (A and C) show the failure locations in the regions bounded by the dashed boxes and (B and D) show the failure locations indicated by arrows. Image parameters: (A, C) 4 × magnification (scale bars: 500 μm); (B, D) 10 × magnification (scale bars: 200 μm). These sections were stained with a tri-chrome Mallory–Heidenhain stain.

