. 2015 Jan 12;97(3):583–598. doi: 10.1189/jlb.4A0714-326R

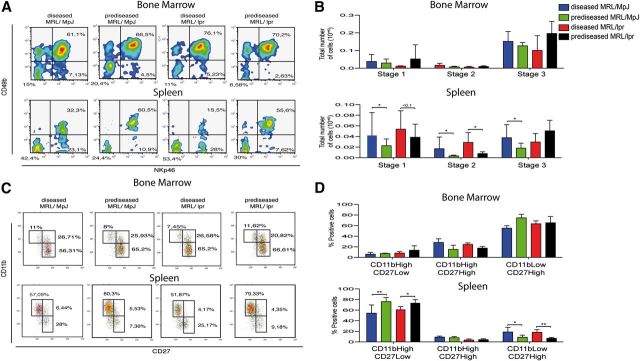
Figure 5. Characterization of iNK and CD11bCD27 NK cell subsets from mouse spleen and BM. (A) Representative flow cytometric density plots show the proportion of CD122+LIN cells. Plots show proportions of Stage 1 (CD122+LINNKp46CD49b), Stage 2 (CD122+LINNKp46+CD49b), and Stage 3 (CD122+LINNKp46+CD49b+) iNK cell groups in spleen and BM. (B) Absolute numbers were calculated for Stages 1–3 iNK cell groups. (C) Representative flow cytometric density plots show the proportion of CD11bCD27 NK cell subsets in spleen and BM from all 4 mouse groups. (D) Percentages of CD11bHighCD27Low, CD11bHighCD27High, and CD11bLowCD27High cells were calculated for splenocytes and BM cells. Gates for each population were set by use of unstained or nonspecific mAb isotype controls. Data were analyzed with a 2-tailed, unpaired Student’s t-test (mean ± sd; n = 4–8 mice/group in 3–6 independent experiments; **P < 0.01; *P < 0.05).

Figure 5.