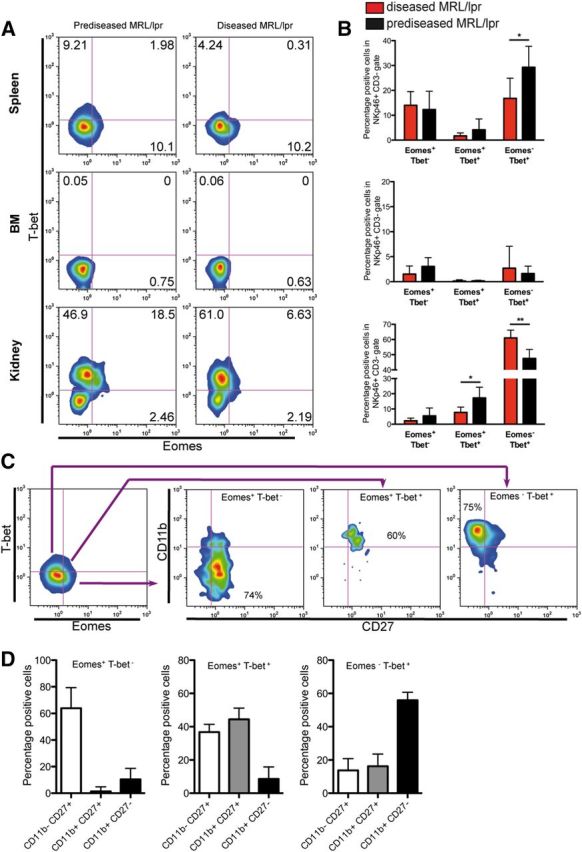
Figure 7. Expression of T-bet and Eomes in NK cells from MRL/lpr mice. Lymphocytes purified from spleen, BM and kidney were analyzed for the expression of T-bet and Eomes by flow cytometry. (A) Representative density plot of NKp46+CD3− cells stained for T-bet and Eomes. (B) NK cells were analyzed for Eomes and T-bet subsets, and the percentage of Eomes+T-bet−, Eomes+T-bet+, and Eomes−T-bet+ cells was calculated. (C) Representative staining for CD27 and CD11b in T-bet/Eomes NK cell subsets in spleen from MRL/lpr mice. (D) The percentage of CD11bCD27 subsets in Eomes+T-bet−, Eomes+T-bet+, and Eomes−T-bet+ NK cell subsets in kidneys was calculated. Similar results were obtained in spleen. Data were analyzed by use of a Mann-Whitney test (diseased vs. prediseased); *P < 0.05; **P < 0.01. Data are presented as mean ± sd of 3 independent experiments (n = 7 mice/group).