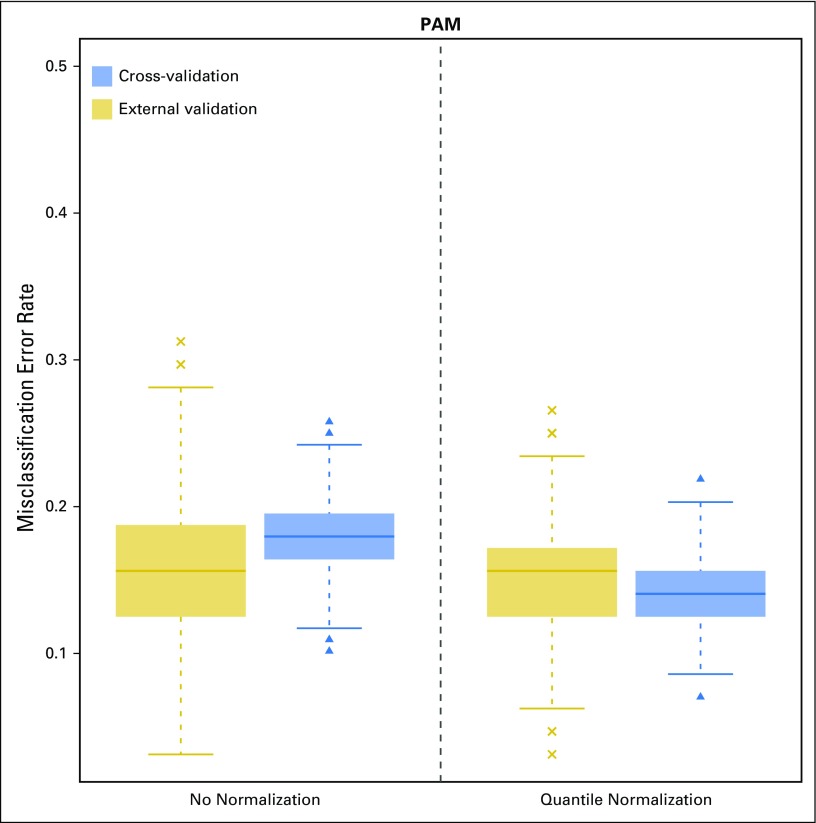
Fig 2.
Box plots of classification error on the basis of 1,000 training-versus-test-set splits of the uniformly handled data set using the prediction analysis for microarrays (PAM) method. The error rate was estimated using (1) cross-validation and (2) external validation in test data. The x-axis indicates the normalization status of the training data (Appendix Table A1, online only).

