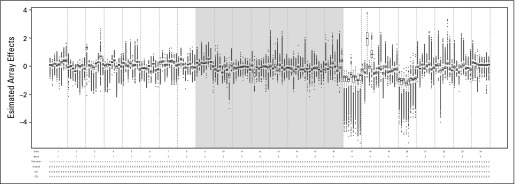
Fig A1.
Box plots of the estimated handling effects for 192 arrays in the nonuniformly handled data set. Array allocation to the training set is indicated by the shading: white for the training set and gray for not used. Below the x-axis are labels for the array slide (indexed as 1-24), handling batch (indexed as 1-5), handling technician (indexed as 1 and 2), sample group assignment in the empirical data (E for endometrial; V for ovarian), and sample group assignment for the simulated designs: Complete Confounding 1 (CC1) and Complete Counfounding 2 (CC2).

