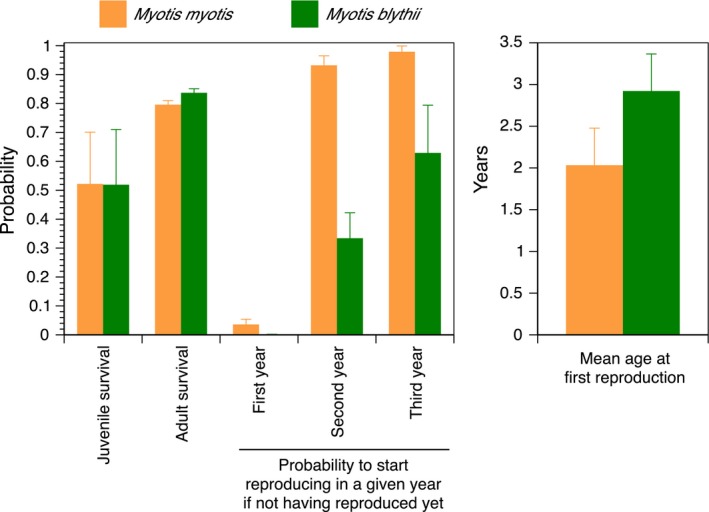
Figure 1.

Mean model‐averaged (across all models of Table 1 with Akaike weight > 0.02) demographic rates of Myotis myotis and Myotis blythii. Given are mean values and unconditional standard errors. Note that for juvenile survival, we provide the geometric mean because this rate was year‐specific in the best models. For reproduction, the probability shown is that of a given female that has not yet reproduced to start reproducing in a given year (1st, 2nd, or 3rd year)
