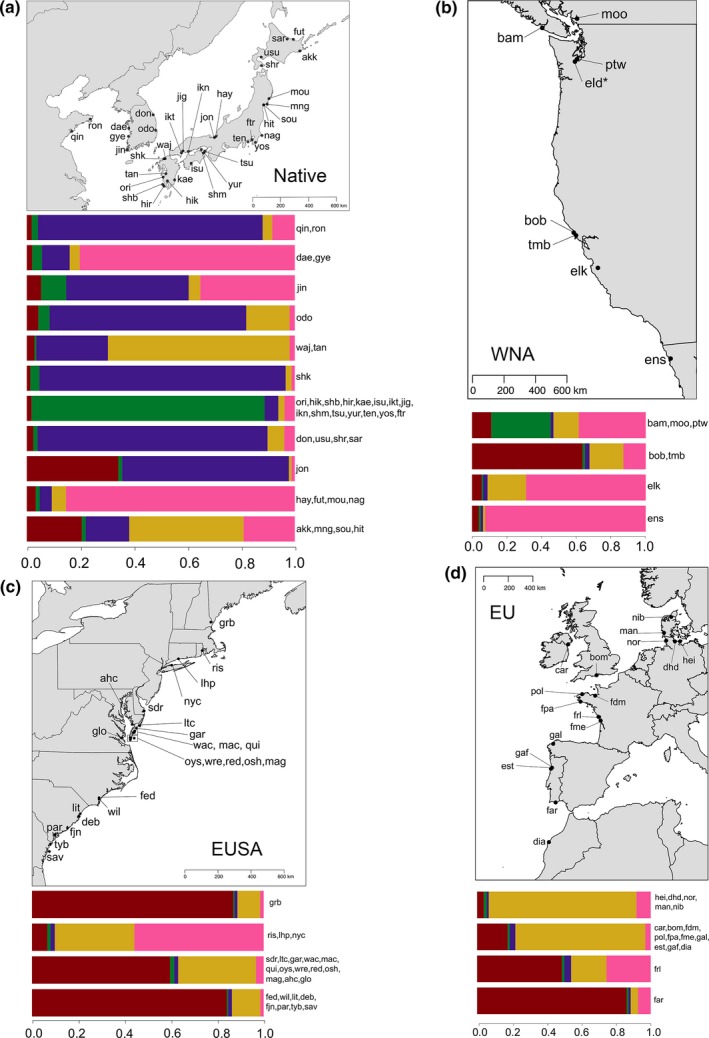
Figure 3.

The mean assignment to five genetic clusters (colored as red, green, purple, gold, and pink) as generated using instruct (Gao et al., 2007) and clumpak (Kopelman et al., 2015). We grouped thalli across sites of similar genetic composition using a visual inspection of individual cluster assignment (see Figure S3e) and used barplots to display individual assignments averaged across sites for that group. As Eld Inlet (eld) had only one unique MLG based on P sex, it was excluded from Bayesian analyses, but is shown on the map
