Figure 4.

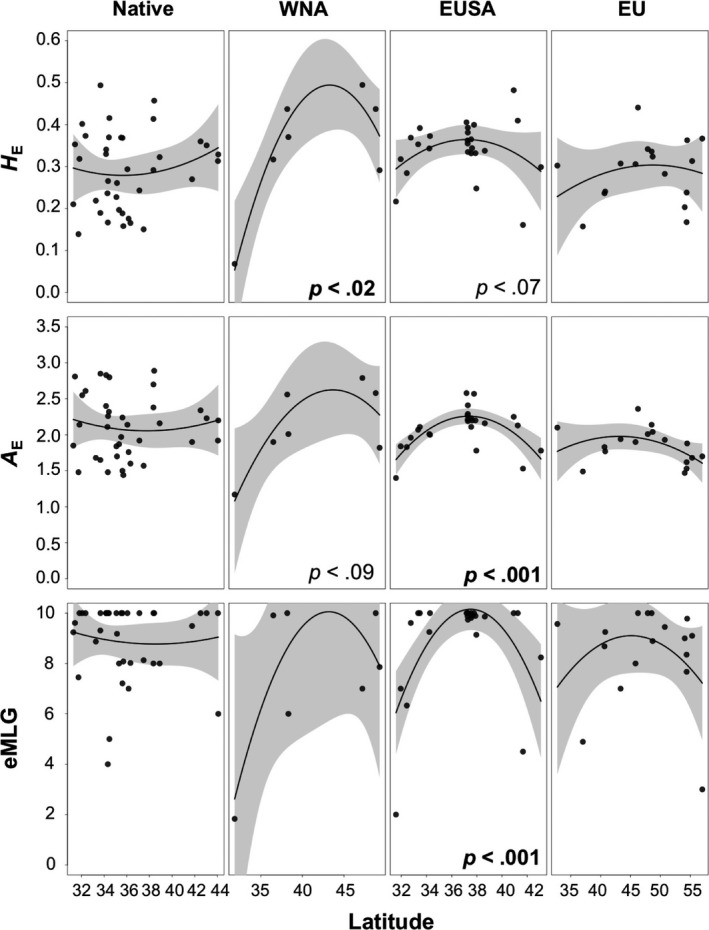
Genetic (H E and A E) and genotypic (eMLG) diversity as a function of latitude along the coastlines of the native range, WNA, EUSA, and EU. Significance values are shown in the plots and bold if less than p = .05

Genetic (H E and A E) and genotypic (eMLG) diversity as a function of latitude along the coastlines of the native range, WNA, EUSA, and EU. Significance values are shown in the plots and bold if less than p = .05