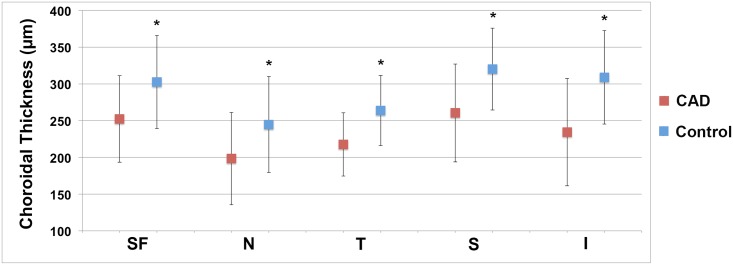
Fig 3. Subfoveal choroidal thickness in coronary artery disease compared to controls.
Mean choroidal thickness at all 5 macular locations was lower in patients with coronary artery disease (red squares) than controls (blue squares). Average choroidal thickness was greatest at the subfoveal, inferior, and superior locations in both groups. Error bars represent standard deviation. SF, subfoveal; N, nasal; T, temporal; I, inferior.

