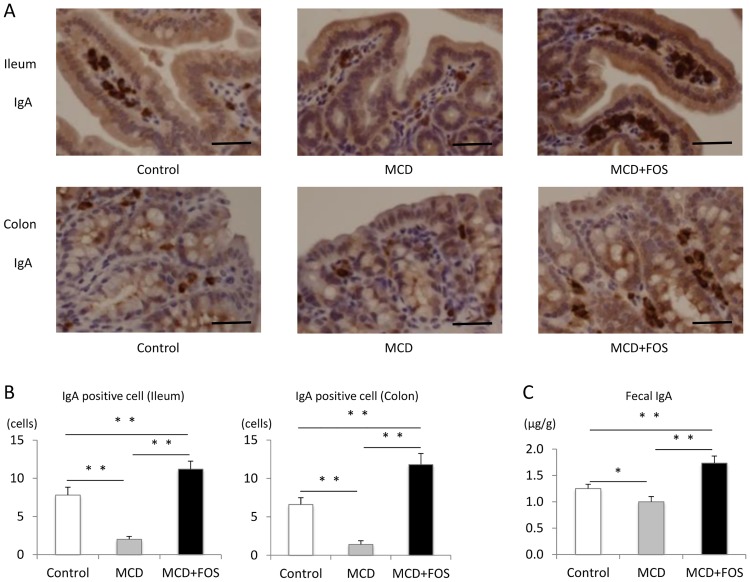
Fig 6. Immunohistochemical evaluation of IgA in ileal and colonic tissues and fecal IgA concentrations of MCD-fed mice with or without FOS treatment.
A. Villus IgA staining in each group (× 600. Bar = 100 μm). B. Villus IgA-positive cells in each group. ** p < 0.01. C. Fecal IgA concentration in each group. * p = 0.01, ** p = 0.003.

