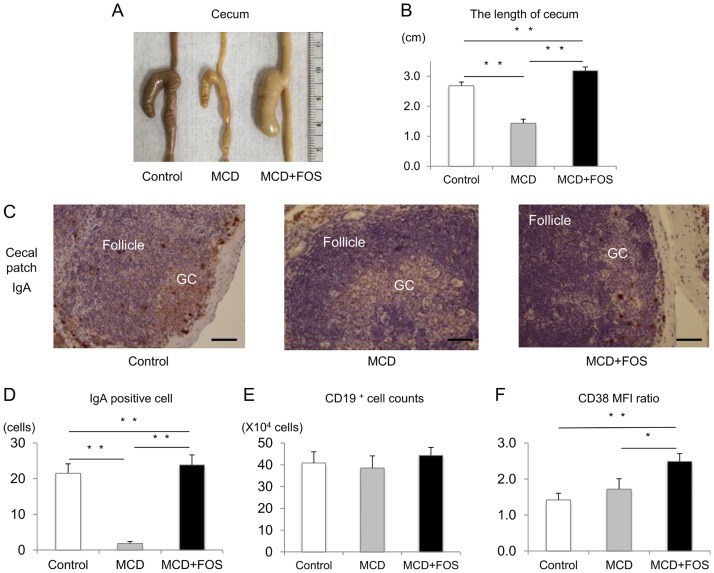
Fig 7. Cecal findings of MCD-fed mice with or without FOS treatment.
A. and B. Macroscopic findings and mean length of the cecum in each group. ** p < 0.01. C. IgA staining of the cecal patch in each group (× 600. Bar = 100 μm). GC denotes germinal center. D. IgA-positive cell counts in each group. ** p < 0.01. E. Flow cytometric analysis of CD19+ B cell numbers (E) and mean fluorescence intensity ratio of CD38 (F) in each group. * p = 0.02.

